





What goes in a budget versus actuals dashboard?
A budget versus actuals dashboard aligns one approved budget version with posted actuals at the same fiscal period, account, entity, and management dimension. Variance signs must make favorable and unfavorable movement obvious.
For: FP&A, department leaders, finance, and executives. Refresh: daily during close; weekly or monthly otherwise.
Source: modeled finance tables in a Metabase-connected database.
What does this dashboard look like?
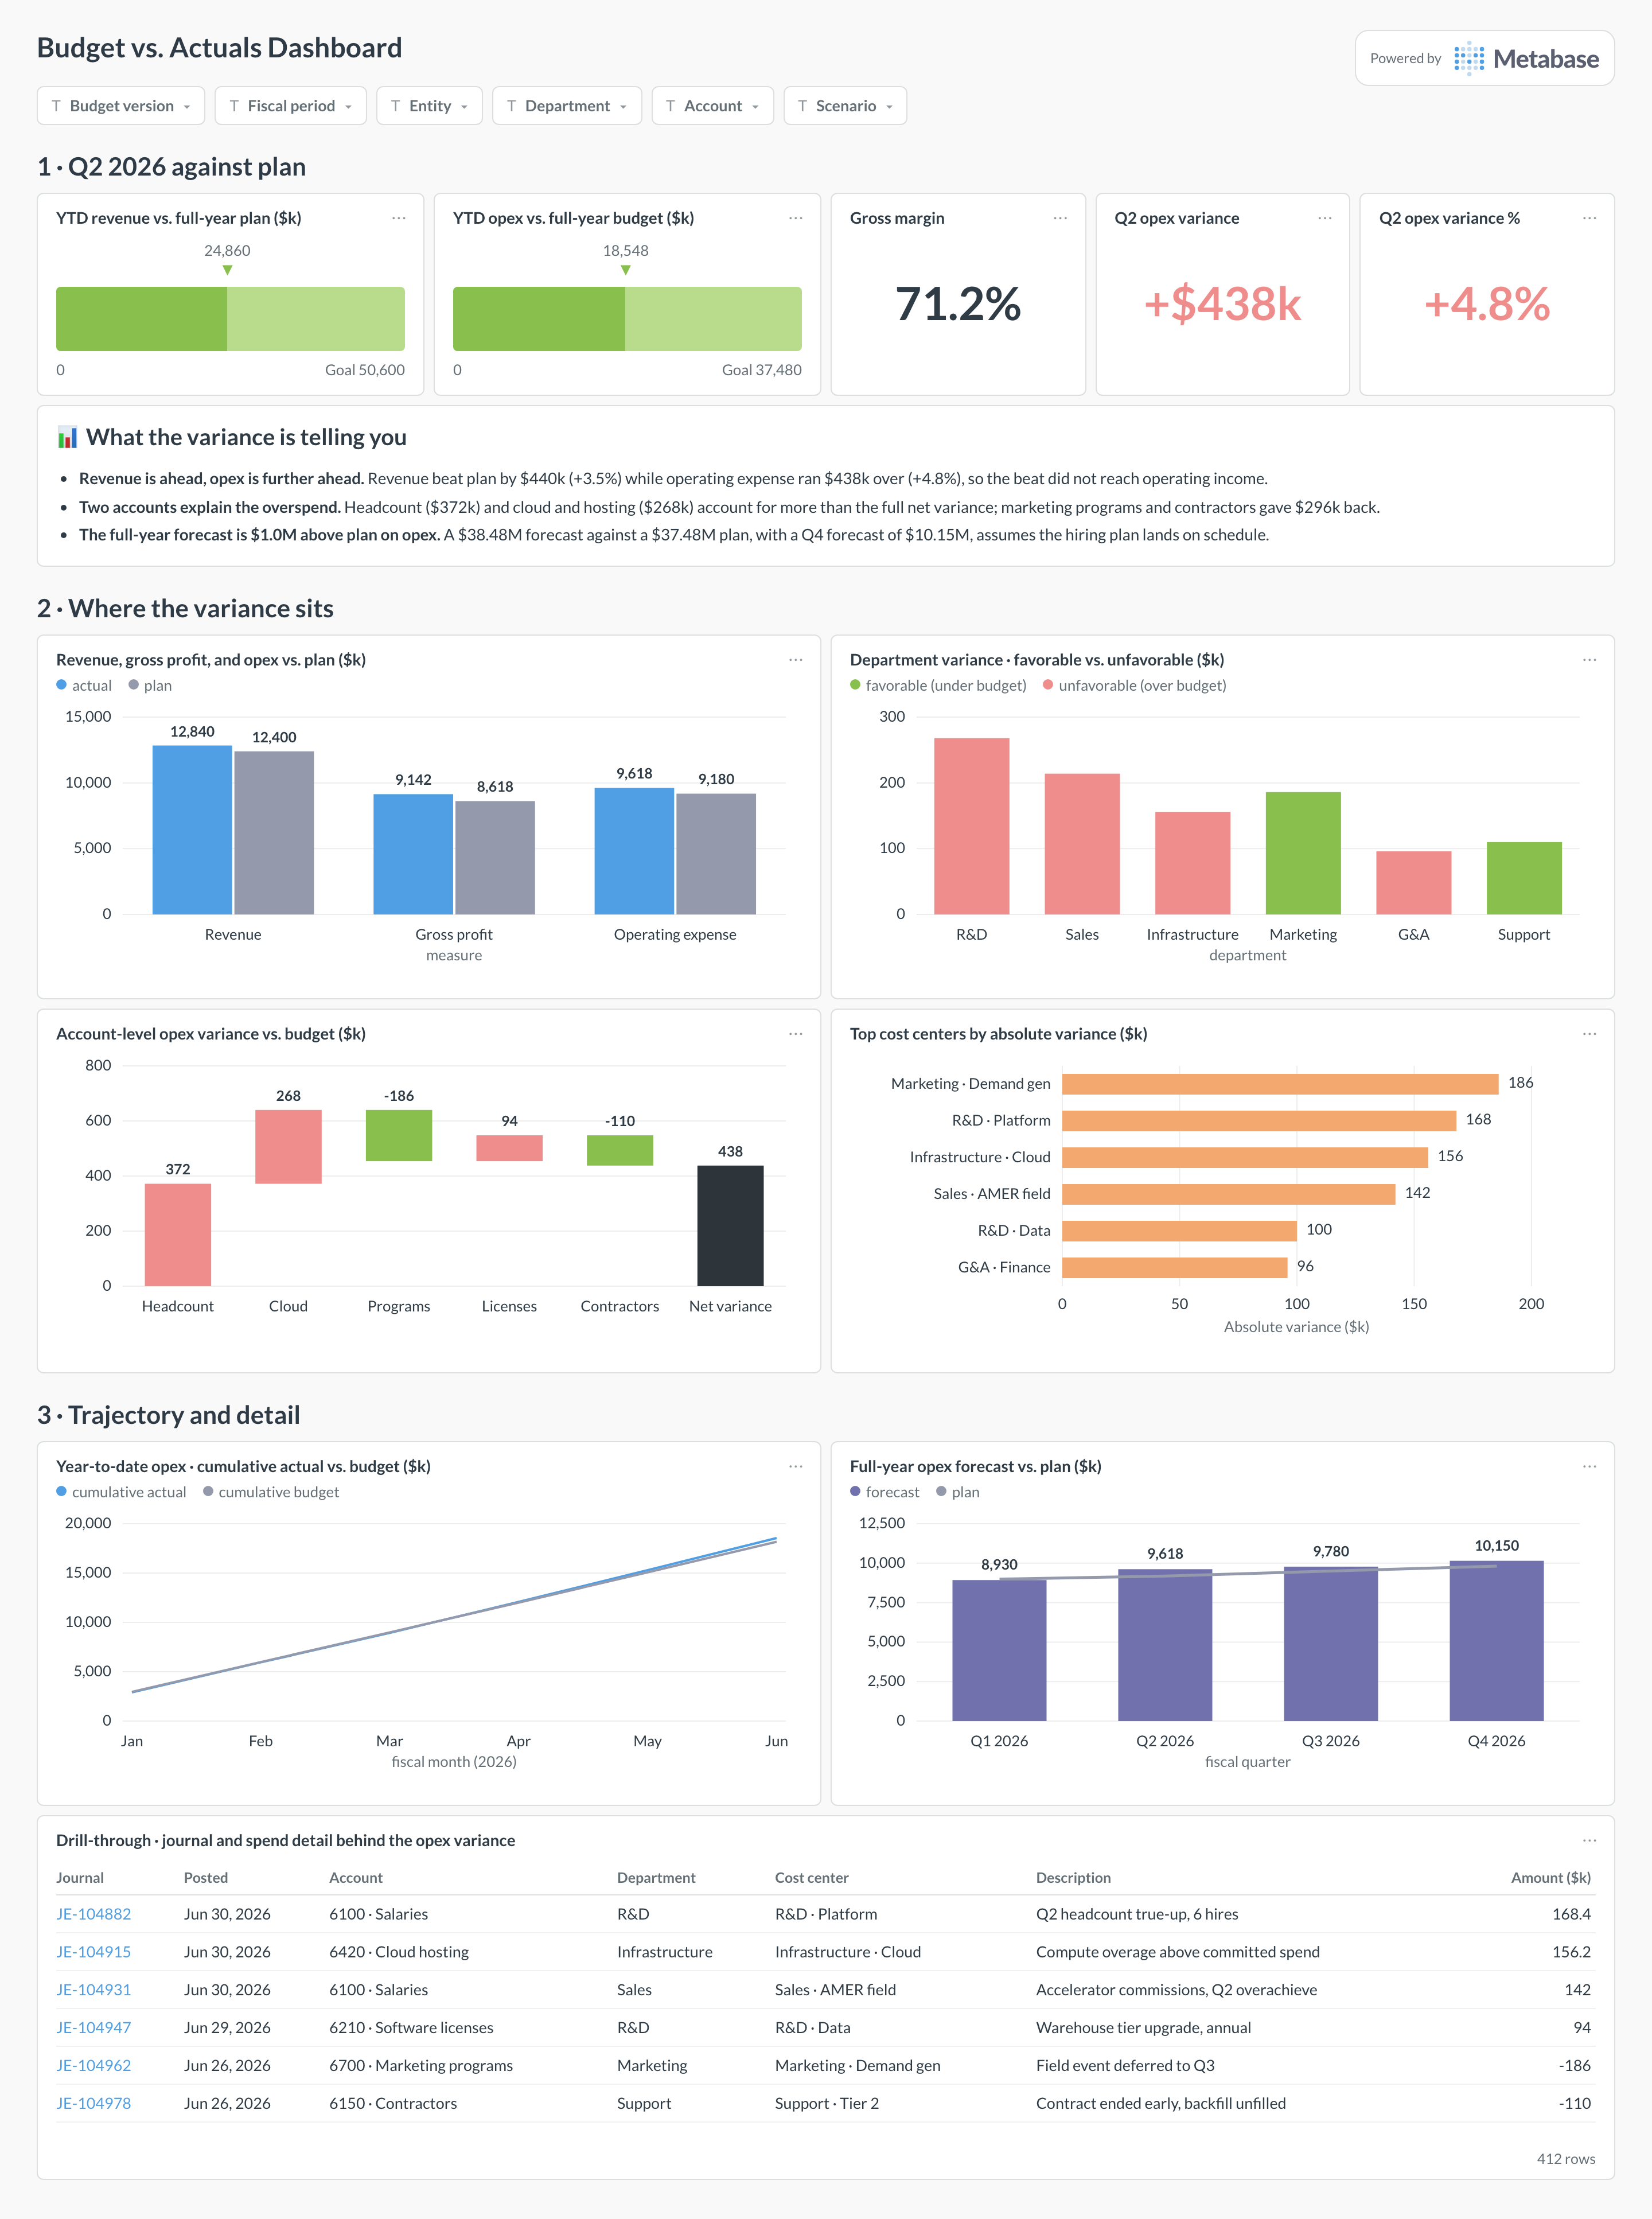
The dashboard reads top-down from quarter-to-plan attainment into where the variance sits and then into the journal lines behind it, which is the order an FP&A review usually follows.
Which cards belong on this dashboard?
- Revenue, gross margin, and operating expense vs. plan
- Absolute and percentage variance
- Favorable vs. unfavorable variance
- Department and cost-center variance
- Account-level variance waterfall
- Year-to-date actual vs. budget
- Full-year forecast vs. plan
- Drill-through to journal or spend detail
What data does this dashboard need?
- Approved budget at account-period-dimension grain
- Posted actuals mapped to the same chart and dimensions
- Fiscal calendar and legal-entity mapping
- Budget version and forecast scenario metadata
- Reporting-currency rates when entities use different currencies
How do you build it?
- Sync the source systems into a database and retain raw IDs, timestamps, status, and currency.
- Build reconciled models at the business grain this dashboard requires.
- Create one saved question per card and certify the shared models and definitions.
- Add dashboard filters for Budget version, fiscal period, entity, department, account, scenario.
- Show refresh time and the latest complete or reconciled period.
Example card SQL
Budget variance by department PostgreSQL
SELECT
  fiscal_period,
  department_name,
  SUM(actual_amount) AS actual,
  SUM(budget_amount) AS budget,
  SUM(actual_amount - budget_amount) AS variance,
  ROUND(100.0 * SUM(actual_amount - budget_amount)
    / NULLIF(ABS(SUM(budget_amount)), 0), 1) AS variance_pct
FROM modeled_budget_actuals
WHERE budget_version = {{budget_version}}
GROUP BY 1, 2
ORDER BY 1, ABS(SUM(actual_amount - budget_amount)) DESC;
Related
Dashboards
Integrations
Metrics
Analytics
FAQ
How should favorable expense variance be signed?
Choose one convention and label it. Many teams use budget minus actual for expense, so underspend is positive.
Can budgets and actuals use different account structures?
Yes, but they need a maintained reporting-account mapping before comparison.