





What is cash runway, and how do you measure it in Metabase?
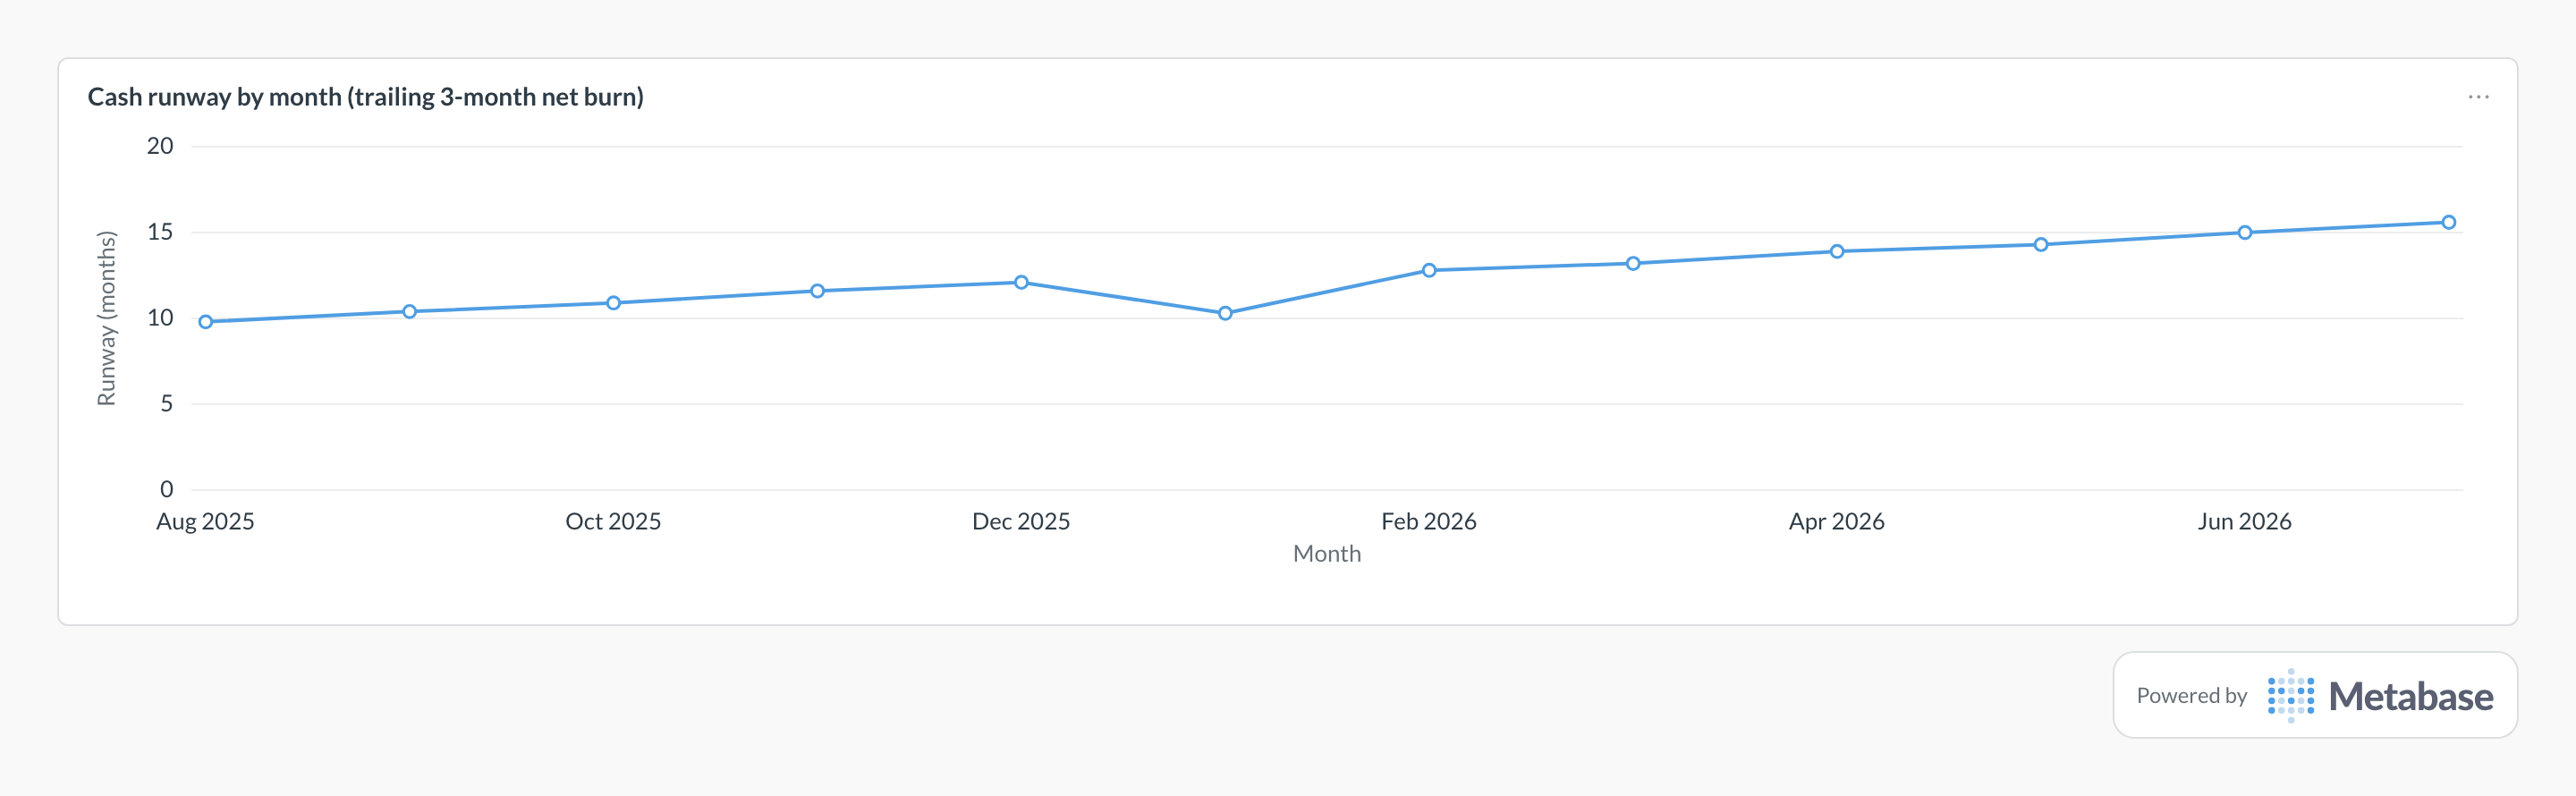
What does a cash runway chart look like in Metabase?
Plot runway in months, recalculated each month from the latest cash balance and trailing net burn, and read the slope rather than any single value. The steady climb means burn is falling faster than cash, while a dip like January's usually traces back to one-time payments inflating the trailing burn window rather than a real change in trajectory.
Definition
Cash runway estimates how many months an organization can continue operating before available cash reaches zero at the current net burn rate. It is a scenario indicator, not a promise: collections, financing, planned cuts, and one-time payments can change it quickly.
What data do you need?
- Latest reconciled cash balances by account and currency
- Restricted-cash classification
- Approved FX rates for reporting-currency conversion
- Monthly operating cash inflows and outflows
- A documented trailing window for net burn
SQL pattern
WITH burn AS (
  SELECT AVG(-net_cash_flow) AS monthly_net_burn
  FROM monthly_cash_flow
  WHERE month >= date_trunc('month', CURRENT_DATE) - INTERVAL '3 months'
    AND net_cash_flow < 0
)
SELECT
  SUM(reporting_currency_balance) AS available_cash,
  burn.monthly_net_burn,
  SUM(reporting_currency_balance)
    / NULLIF(burn.monthly_net_burn, 0) AS runway_months
FROM latest_cash_balances
CROSS JOIN burn
WHERE is_restricted = FALSE
GROUP BY burn.monthly_net_burn;
Common pitfalls
Where does this metric apply?
This metric commonly uses data from NetSuite, Plaid, Xero, QuickBooks, Wise, Airwallex, SAP, plus any reconciled warehouse or ledger models that provide the same business grain.