





What is gross margin, and how do you measure it in Metabase?
What does a gross margin chart look like in Metabase?
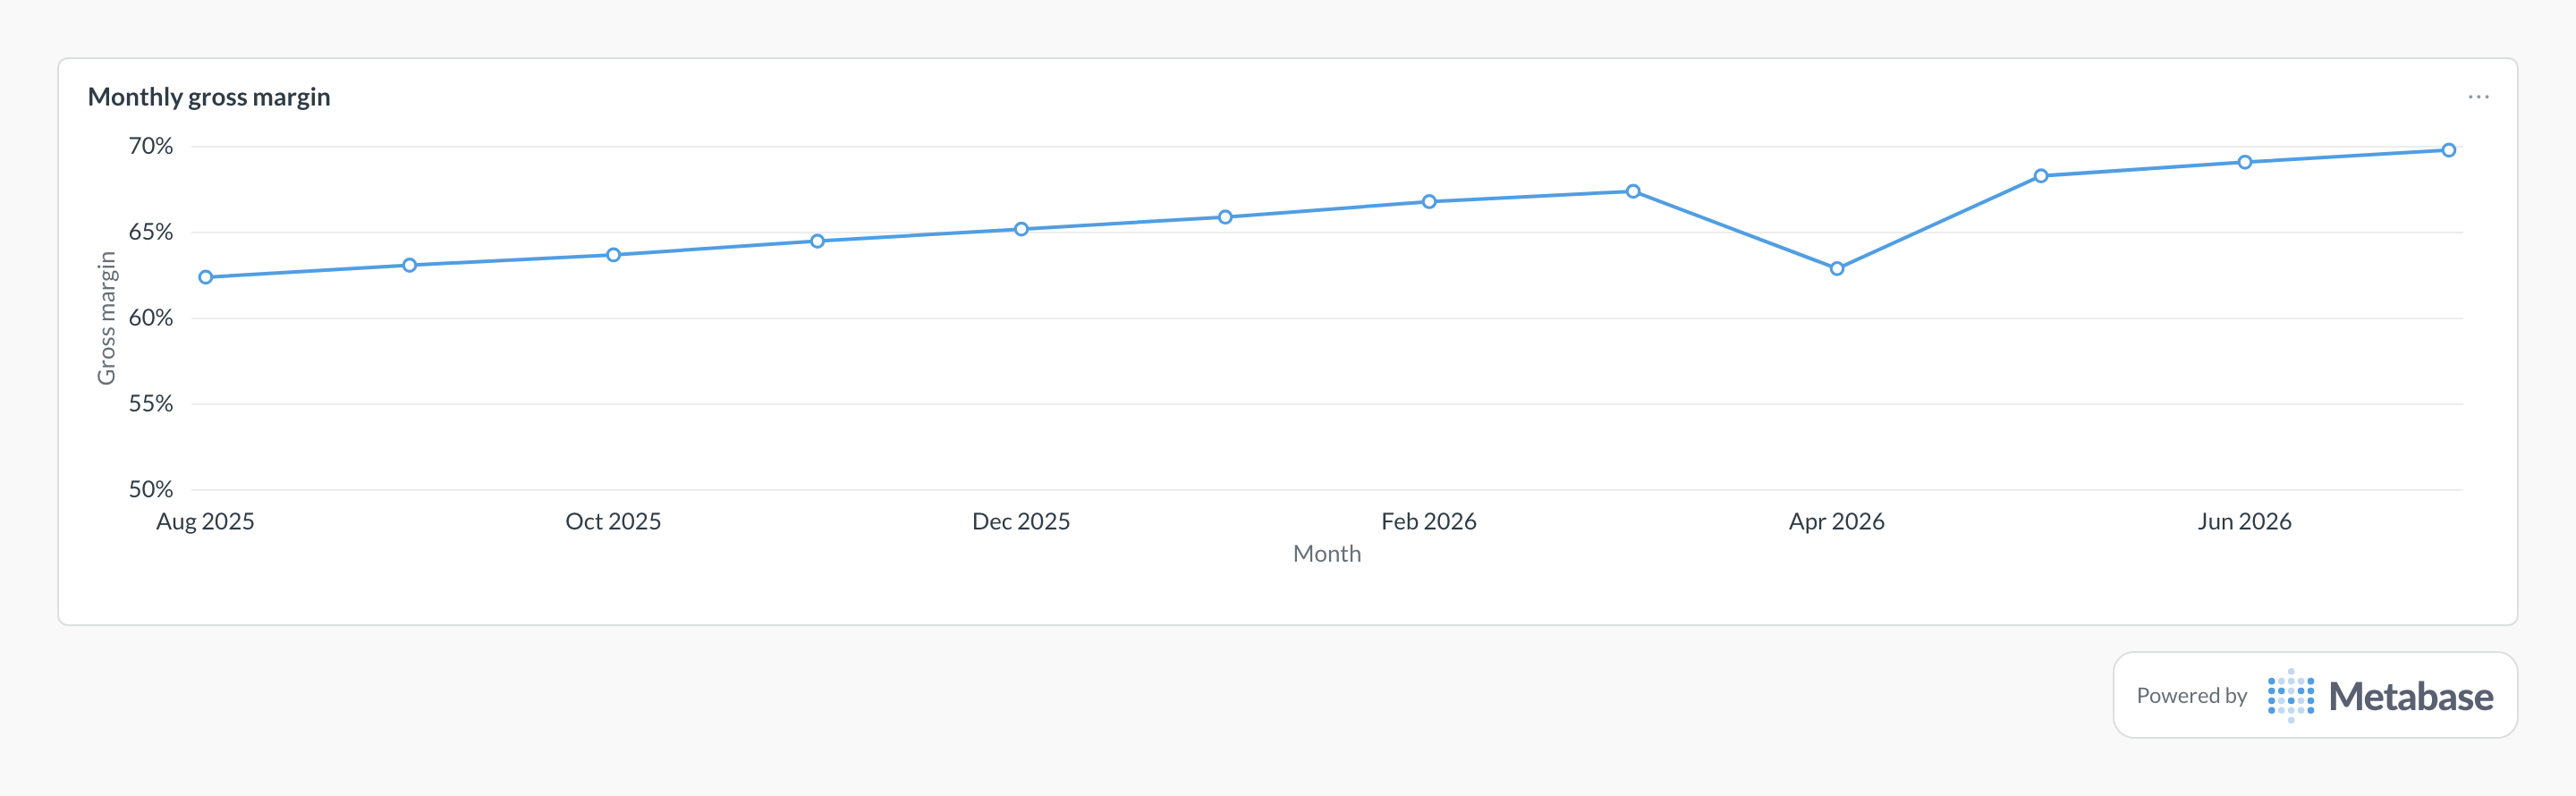
Chart gross margin as a monthly line and watch the level, not just the direction: the steady climb toward 70% means cost of revenue is growing slower than revenue. A one-month dip like April's typically comes from a discrete cost event — an infrastructure migration double-running for a month — rather than pricing, so annotate it and confirm the line recovers.
Definition
Gross margin is the share of revenue remaining after direct costs required to deliver the product or service. The hard part is not the arithmetic; it is agreeing which accounts and operational costs belong in revenue and cost of revenue.
What data do you need?
- Posted revenue journal lines
- Posted cost-of-revenue journal lines
- Maintained account classification
- Product, segment, customer, and period dimensions
- Credits, refunds, discounts, and revenue-recognition rules
SQL pattern
SELECT
  fiscal_month,
  SUM(CASE WHEN reporting_group = 'Revenue' THEN amount ELSE 0 END) AS revenue,
  SUM(CASE WHEN reporting_group = 'Cost of revenue' THEN amount ELSE 0 END) AS cost_of_revenue,
  ROUND(100.0 * (
    SUM(CASE WHEN reporting_group = 'Revenue' THEN amount ELSE 0 END)
    - SUM(CASE WHEN reporting_group = 'Cost of revenue' THEN amount ELSE 0 END)
  ) / NULLIF(SUM(CASE WHEN reporting_group = 'Revenue' THEN amount ELSE 0 END), 0), 2) AS gross_margin_pct
FROM modeled_gl
WHERE is_posted = TRUE
GROUP BY 1
ORDER BY 1;
Common pitfalls
Where does this metric apply?
This metric commonly uses data from NetSuite, Xero, QuickBooks, SAP, plus any reconciled warehouse or ledger models that provide the same business grain.