What is an ERD?
Also known as
Entity relationship diagram
Entity relationship model
An ERD, or entity relationship diagram, is a graphical representation of how tables in a database connect to each other. ERDs show a database’s structure (or schema) at a high-level. ERDs are a useful tool when designing a new data model or identifying issues within an existing schema.
Entity relationship diagrams are basically just boxes (your entities, or tables) connected with lines (the relationships between them). Your database software may have some built-in functionality to create ERDs, but you can also use whatever design software you like best or go the analog route and draw out your ERD on a piece of paper. The how is less important; what really matters is making sure that your diagram is accurate and logical, so you can design the most effective database for your specific use case.
Example ERD
Here’s an example of an ERD showing Metabase’s Sample Database:
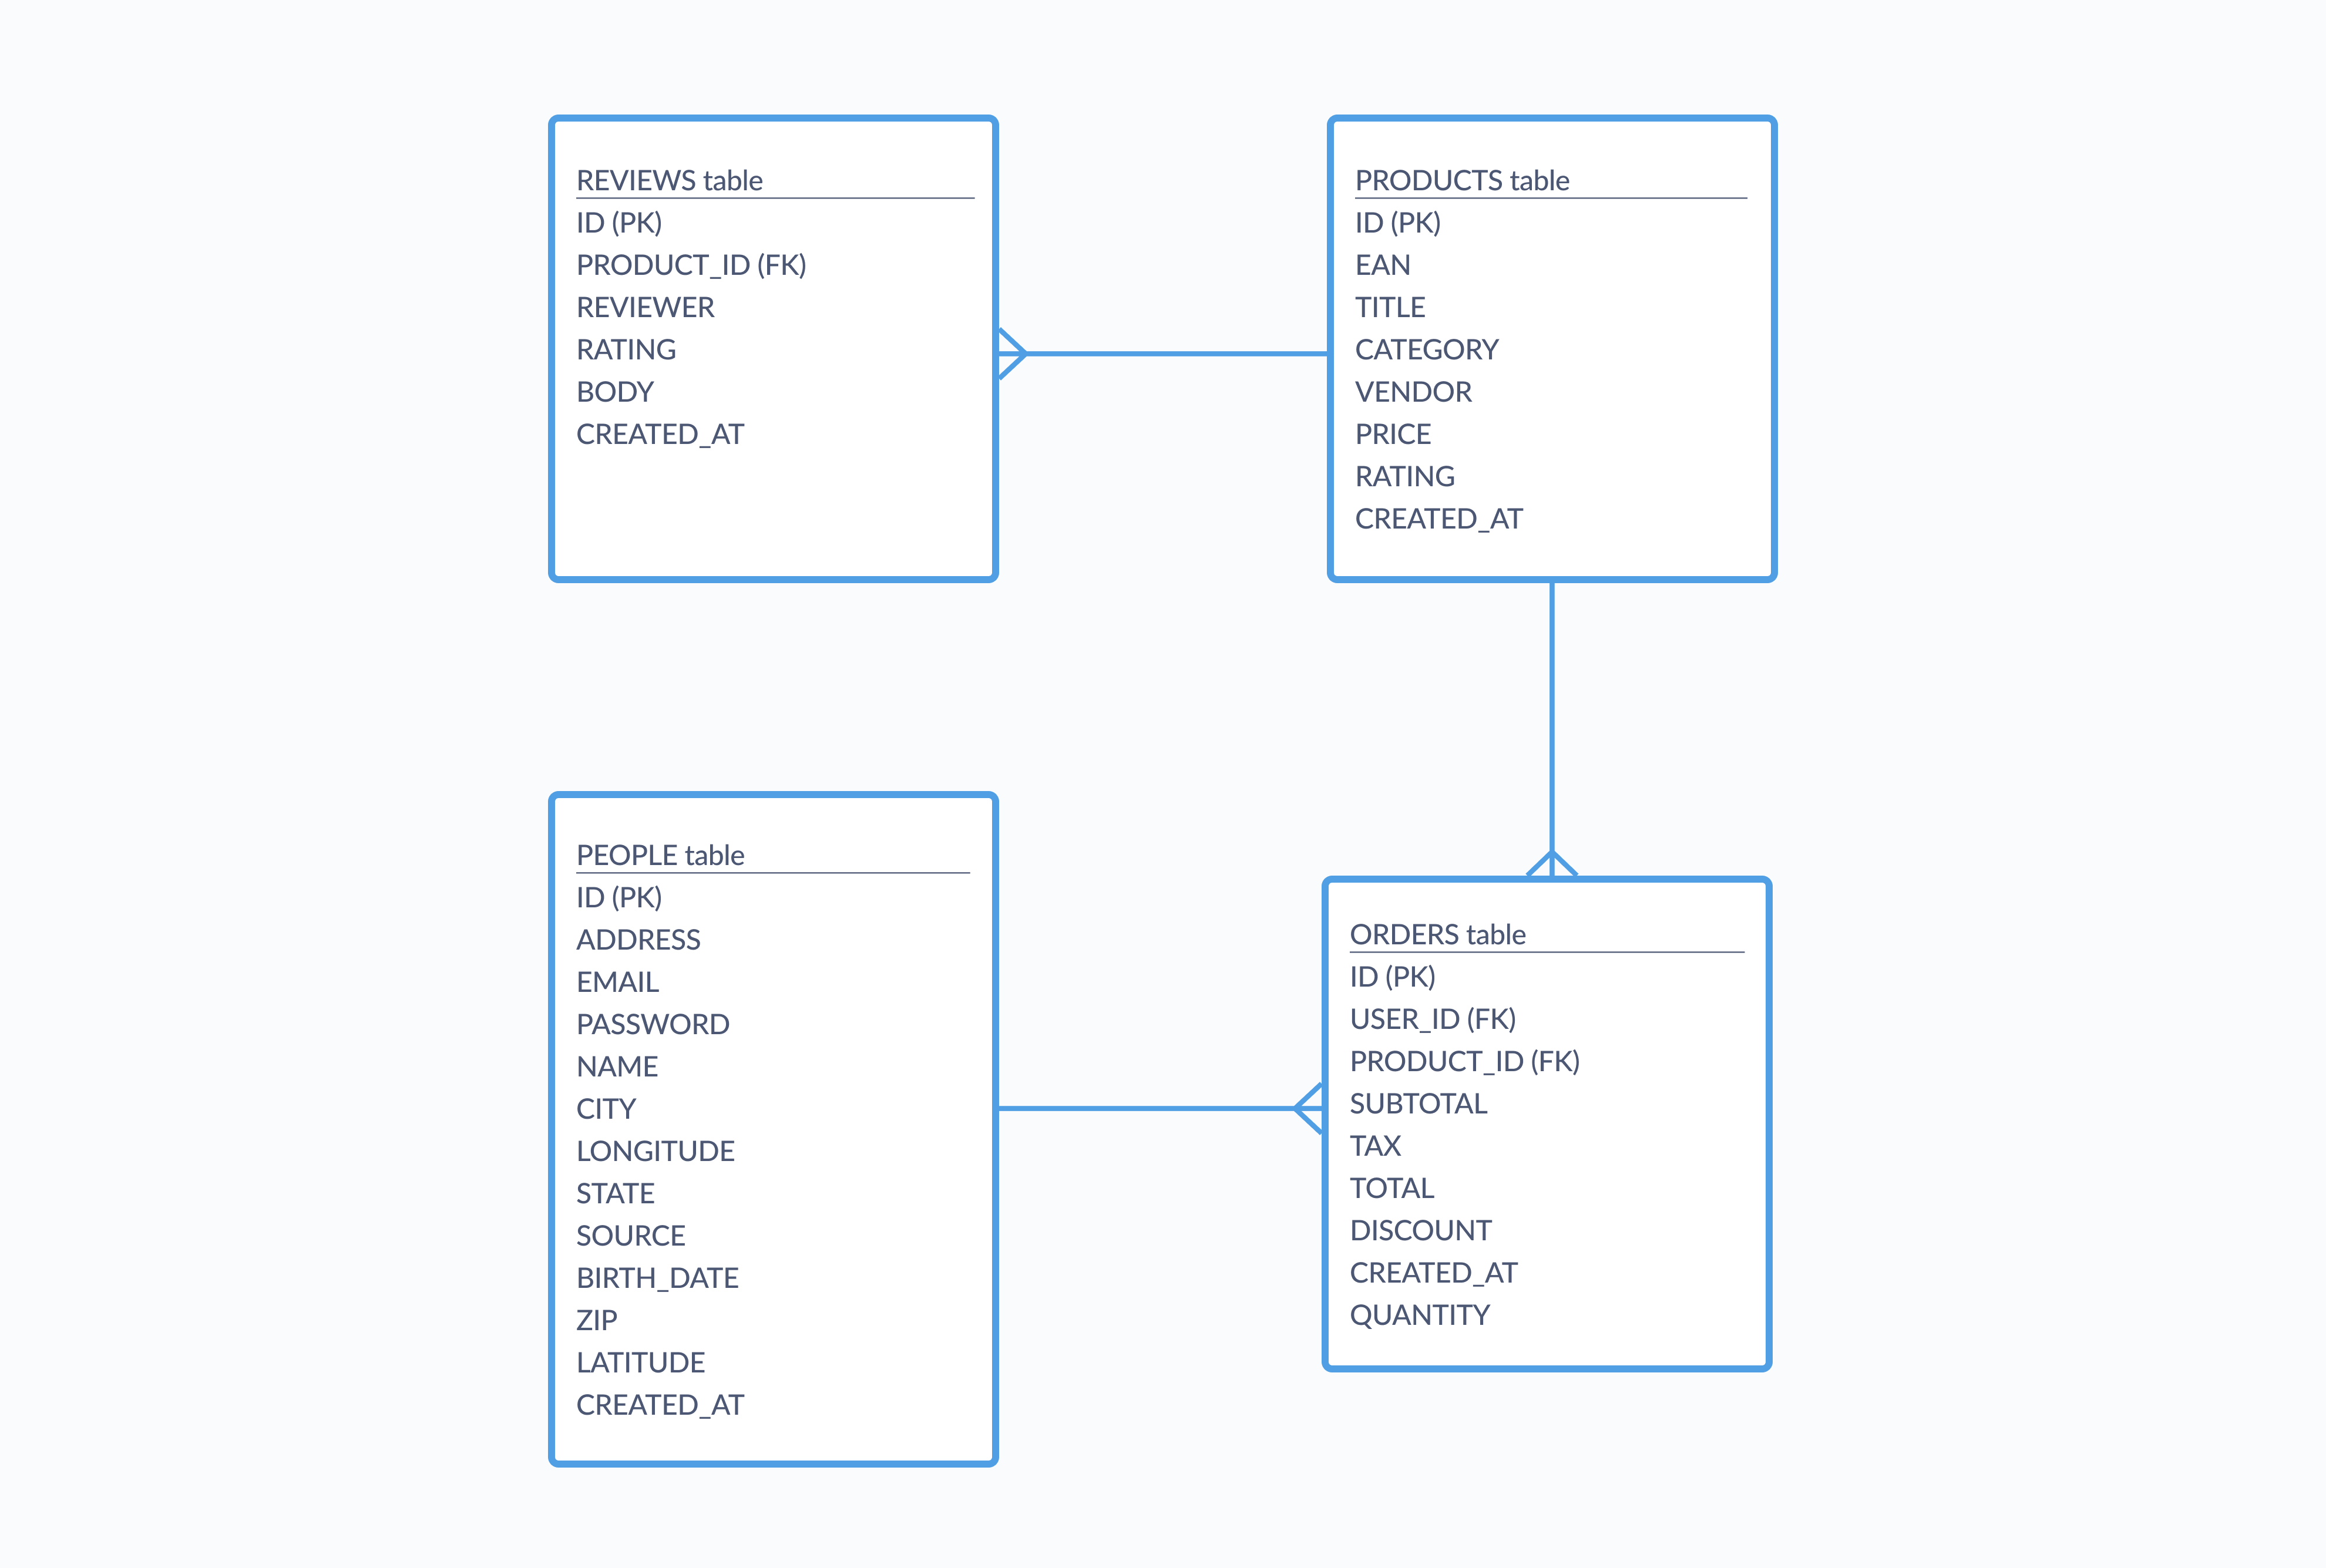
The four tables, Orders, Products, People, and Reviews, are our entities, and the connecting lines show the three one-to-many relationships between them.
ERD design and notation
When sketching out an entity relationship diagram, each box should contain information like that table’s name, field, and key information (primary and foreign keys). You’ll notice in the example above that each table’s key information is indicated with (PK) and (FK) next to field names.
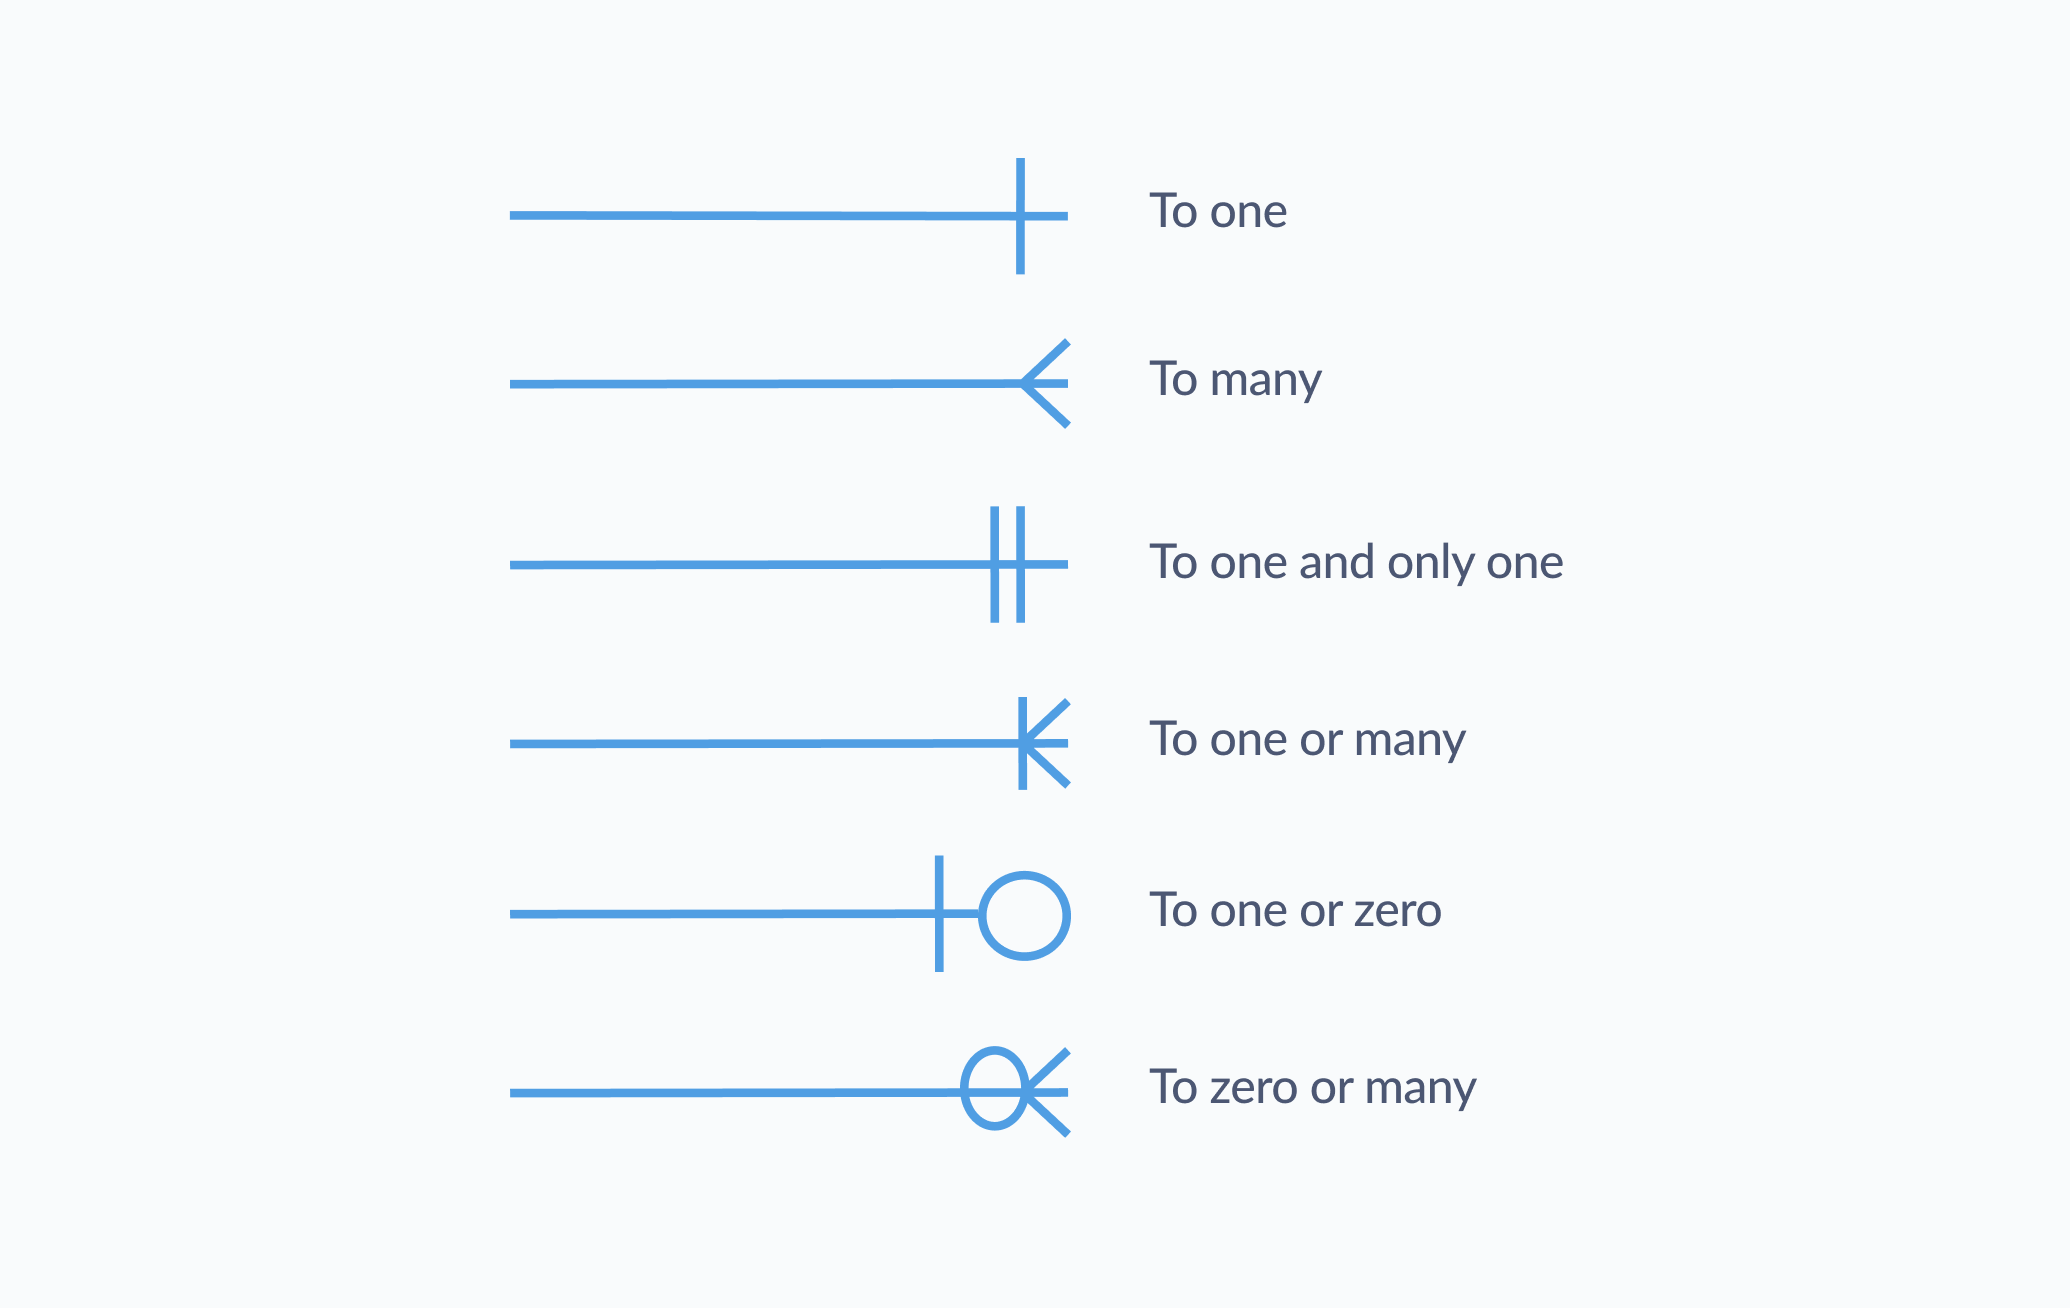
The type of line between each entity illustrates the kind of relationship each table has to another. Different organizations and industries use different conventions for ERD notation, but one of the most common is crow’s foot notation, named because the three-pronged symbol (the one that gets used for “to many”) looks a bit like the foot of a bird. Figure 2 shows the common symbols used in crow’s foot notation and their corresponding relationship types: