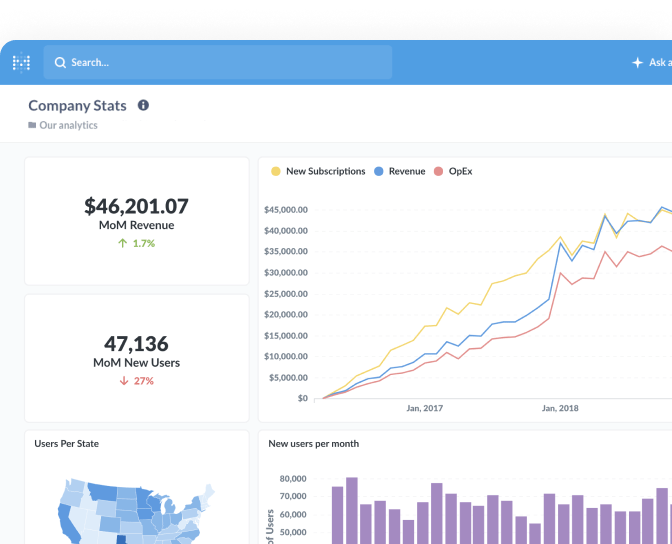


OLAP stands for online analytical processing: processing that involves a small number of large operations, such as creating quarterly reports. “How did revenue break down by plan and region over the last eight quarters?” is an OLAP question. Answering it means scanning a lot of rows, grouping them, and returning a handful of numbers.
OLAP is the counterpart to OLTP, which handles a large number of small operations. The two workloads pull database design in opposite directions, which is why most companies eventually run both kinds of system.
What OLAP workloads look like
Analytical queries share a shape:
- They touch a lot of rows but return few, because they end in an aggregation like
SUM,COUNT, orAVG. - They read a few columns out of wide tables, rather than whole records.
- They’re mostly read-only. Data arrives in scheduled batches, not one transaction at a time.
- They’re unpredictable. Nobody knows in advance which grouping someone will want next.
Here’s a typical one:
SELECT
    date_trunc('quarter', created_at) AS quarter,
    plan,
    sum(subtotal) AS revenue
FROM orders
GROUP BY 1, 2
ORDER BY 1
That query reads two columns from potentially hundreds of millions of rows and returns a few dozen. On a database tuned for single-row lookups, it’s expensive; on one tuned for analytics, it’s routine.
How OLAP systems are built for it
Analytical databases — Snowflake, BigQuery, Redshift, ClickHouse, DuckDB — make different trade-offs than transactional ones:
- Columnar storage. Values from the same column live together, so a query that reads two of forty columns only pays for two.
- Compression. Columns of similar values compress well, which cuts how much data has to come off disk.
- Denormalized schemas. A star schema keeps a wide fact table beside smaller dimension tables, trading redundancy for fewer joins.
- Parallel scans. Work is spread across nodes, because scanning is the bottleneck.
The older, narrower meaning of OLAP — precomputed multidimensional “cubes” that you slice and dice — still shows up in vendor documentation. Modern columnar warehouses mostly do the same job by querying raw tables fast enough that precomputation isn’t required.
Getting OLAP data in the first place
Your source data usually starts in transactional systems and SaaS tools. Moving it into an analytical store is what ETL and ELT pipelines are for. Once it’s there, a BI tool can sit on top so people can ask questions without writing SQL by hand.
Related terms
Further reading
Put it to work
- Revenue analytics — Overview
- Cohort retention — Dashboard
- Build a data pipeline — Integration