




What are net new leads, and how do you measure them in Metabase?
Net new leads is the count of genuinely new leads created in a period — leads created minus duplicates, junk, and disqualified records. It's the honest version of top-of-funnel volume: the number that should agree with cost per lead and hold up when sales audits it. Measure it in Metabase from CRM data synced from HubSpot, Salesforce, or Pipedrive.
created − merged − disqualified, per
month and source, with the dedup rule (email vs. person vs. account) written
into one SQL model. The subtraction is the metric: without it you're
counting CRM records, not demand.
What does a net new leads chart look like in Metabase?
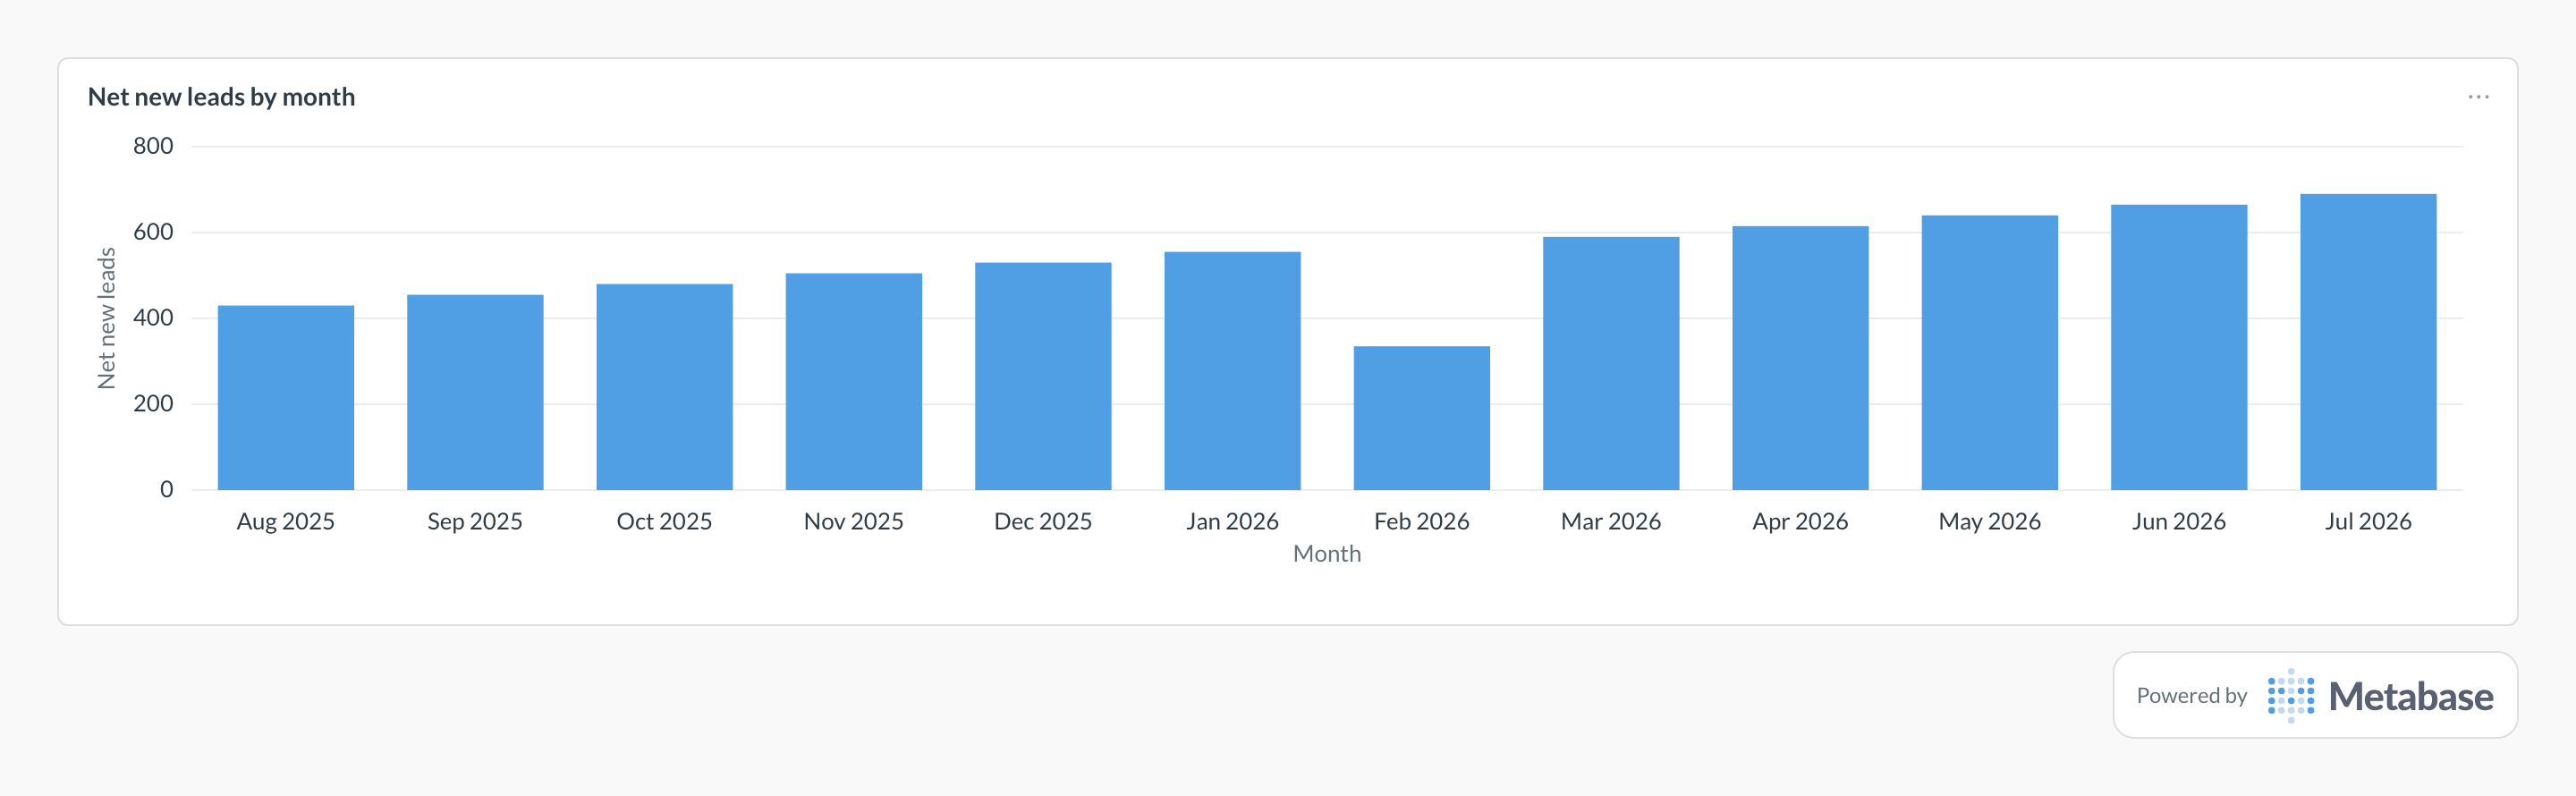
Chart net new leads — created minus merged and disqualified — per month as bars, and trust the growth because the junk is already subtracted. A one-month drop like Feb 2026's often traces to a dedup cleanup or a paused campaign rather than shrinking demand, so check the merge counts before sounding the alarm.
What net new leads measures
It measures how many new potential buyers actually entered the funnel. That makes it the volume input for everything downstream — conversion rates need a trustworthy denominator, capacity plans need a real inflow number, and channel comparisons need each source's count cleaned the same way. It also keeps marketing honest with itself: a list import or a viral junk-form day inflates leads created and leaves net new leads unmoved, which is exactly the point.
What counts as net new
Three rules define the metric, and all three belong in a versioned SQL model rather than in each analyst's head. First, the dedup level: same email, same person, or same account — each stricter level yields a smaller, more sales-shaped number. Second, the exclusion list: merged duplicates, spam and test submissions, competitors, and out-of-ICP records marked disqualified. Third, the timing convention: count the lead in its creation month regardless of when it's later merged or disqualified, or accept that history restates as hygiene catches up — either works, but the dashboard must say which. Teams that skip this step get a trend line that quietly shrinks backward every time someone cleans the CRM.
What data does it need?
-
A CRM
leadstable withcreated_at,source,status, and a merge pointer likemerged_into_id— HubSpot, Salesforce, and Pipedrive all expose these through their standard sync schemas. -
A
meetingsor activities table keyed by lead for follow-through analysis. - A fixed source-attribution rule, so "organic" and "paid" mean the same thing in every month of the trend.
SQL patterns
SELECT
  date_trunc('month', created_at) AS month,
  source,
  COUNT(*) AS leads_created,
  COUNT(*) FILTER (WHERE merged_into_id IS NOT NULL) AS duplicates,
  COUNT(*) FILTER (WHERE status = 'disqualified') AS disqualified,
  COUNT(*) FILTER (
    WHERE merged_into_id IS NULL
      AND status <> 'disqualified'
  ) AS net_new_leads
FROM leads
WHERE created_at >= CURRENT_DATE - INTERVAL '12 months'
GROUP BY 1, 2
ORDER BY 1, 2;WITH net_new AS (
SELECT
id,
date_trunc('month', created_at) AS cohort_month
FROM leads
WHERE merged_into_id IS NULL
AND status <> 'disqualified'
AND created_at >= CURRENT_DATE - INTERVAL '12 months'
),
met AS (
SELECT DISTINCT lead_id
FROM meetings
WHERE status = 'held'
)
SELECT
n.cohort_month,
COUNT(*) AS net_new_leads,
COUNT(m.lead_id) AS leads_with_meeting,
ROUND(
100.0 * COUNT(m.lead_id) / NULLIF(COUNT(*), 0), 1
) AS lead_to_meeting_pct
FROM net_new n
LEFT JOIN met m ON m.lead_id = n.id
GROUP BY 1
ORDER BY 1;Pitfalls
Where this metric applies
- HubSpot + Metabase — contacts with lifecycle stages and merge history
- Salesforce + Metabase — lead objects with status and converted flags
- Pipedrive + Metabase — persons and deals for source-level funnels
- Attio + Metabase — people and companies for account-level dedup
Related
Metrics
Dashboards
FAQ
Net new leads vs. total leads created — why subtract anything?
Should we dedup by email, person, or account?
Our lead volume trend broke after we changed the MQL threshold — why?
How do you calculate net new leads?
COUNT(*) FILTER (WHERE merged_into_id IS NULL AND status <> 'disqualified') grouped by month and source. Two conventions matter: attribute the lead to its creation month even if it's disqualified later (so history doesn't silently shrink — or accept restatement and say so), and keep source attribution rules fixed across channels so the by-source split from HubSpot or Salesforce stays comparable.