




What is sync success rate, and how do you track it in Metabase?
Sync success rate is the share of data-pipeline runs that complete successfully, per destination. It's the headline reliability metric for a customer data stack: when it slips, every downstream tool — email, ads, support, analytics — quietly works from stale or partial data. Measure it in Metabase from the run logs your CDP and reverse-ETL tools produce (Segment, RudderStack, Hightouch, and others).
What does a sync success rate chart look like in Metabase?
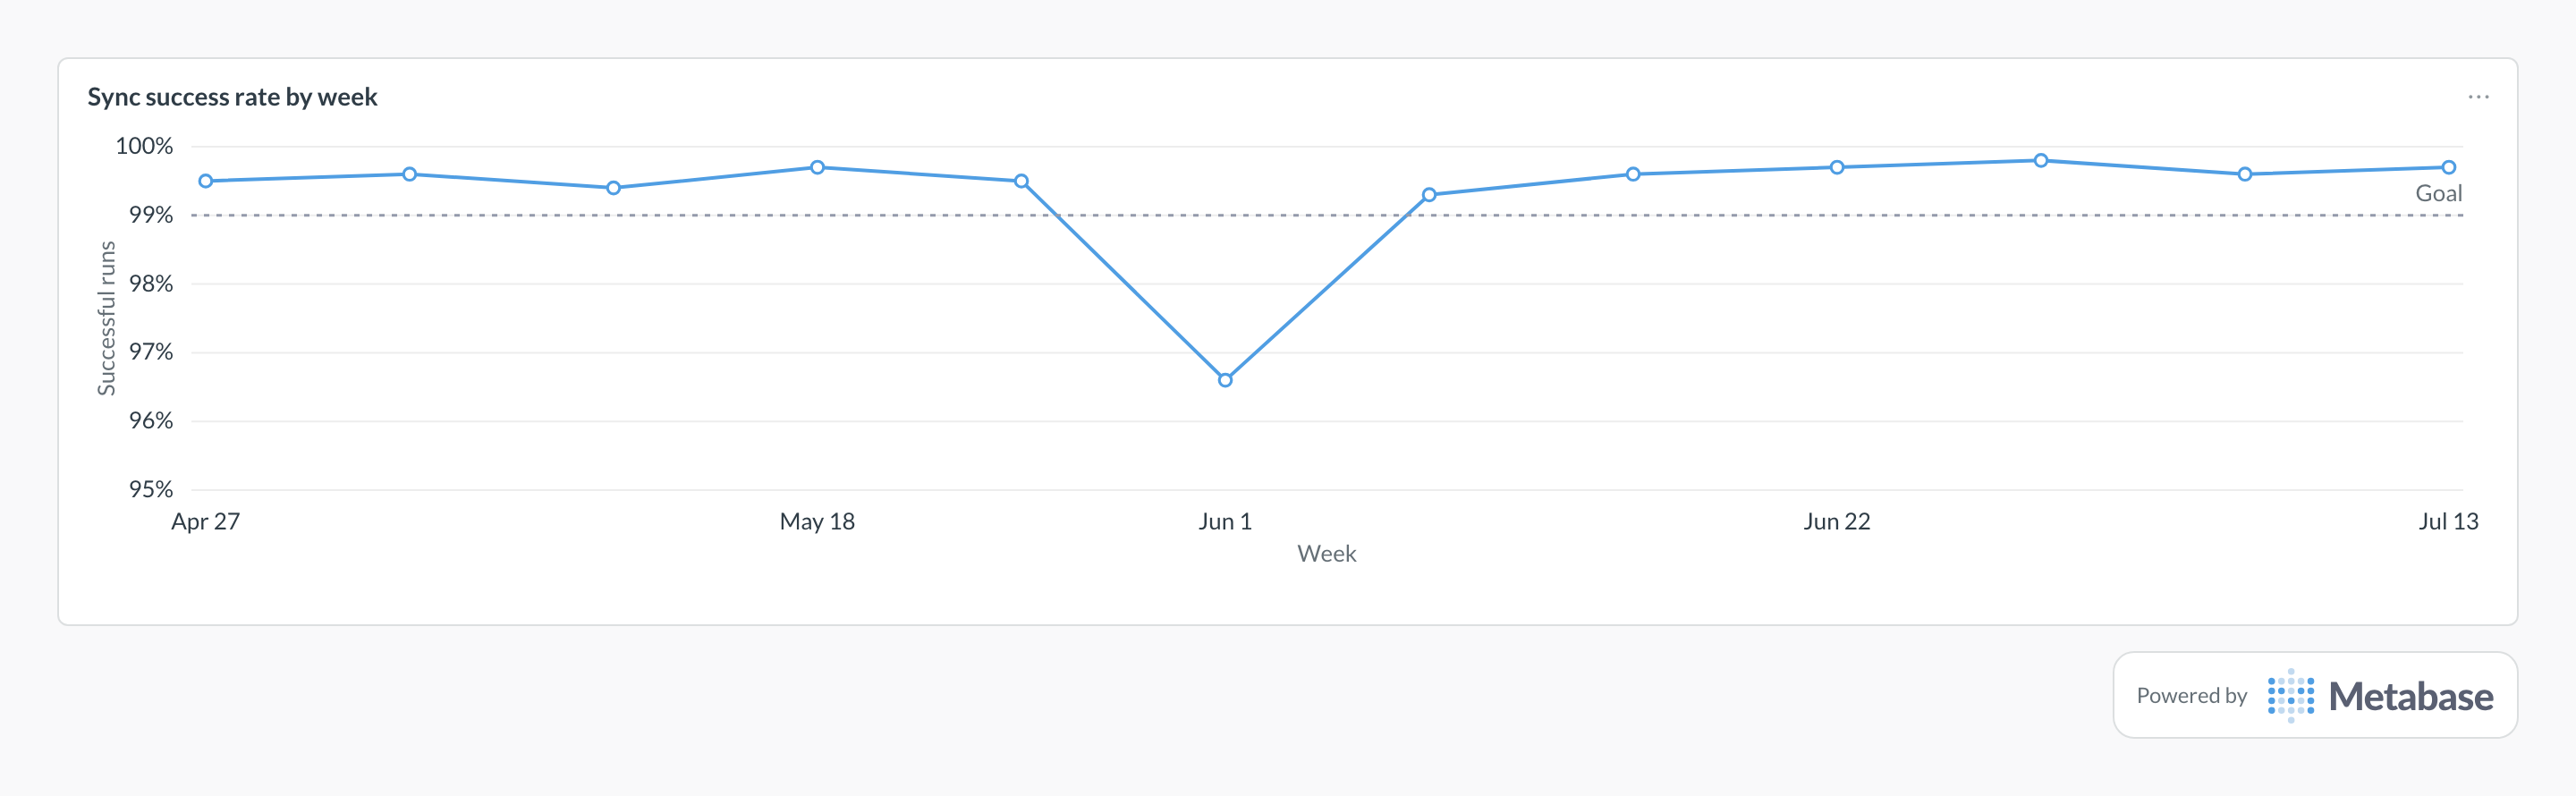
Plot successful runs as a share of all runs per week against your target, on an axis zoomed to where the data lives — at full scale a 99% week and a 96% incident look identical. Healthy weeks hug the goal line, and a dip like Jun 1's is the signature of one destination failing hard, usually expired credentials or an API change.
How is sync success rate defined?
The formula is successful runs ÷ total runs over a window, grouped by destination. The grouping is the point: a healthy global average routinely hides one destination failing continuously.
- Run — one scheduled or triggered execution of a sync from a source to a destination.
- Successful — the run finished without a fatal error. Count partial completions separately; they're their own signal.
Runs vs. rows
Run-level success rate catches hard failures: expired credentials, API version changes, destination outages. But activation tools often mark a run successful while rejecting individual rows — invalid emails, missing required fields, rate-limited batches. Track both:
- Run success rate —
successful_runs ÷ runs. The pager metric. - Row success rate —
rows_synced ÷ rows_attempted. The data-quality metric; a slow decline here means a schema or hygiene problem growing in the source.
What data does sync success rate need?
-
A sync run log with one row per run:
run_started_at,run_finished_at,status, source, destination. -
Row counts per run (
rows_attempted,rows_synced, rejected rows) where the tool reports them. - An error category or message for failed runs, for the triage table.
- The expected schedule per sync, so missed runs count against the rate instead of disappearing from it.
SQL patterns
SELECT
  destination,
  date_trunc('week', run_started_at) AS week,
  COUNT(*)                                      AS runs,
  COUNT(*) FILTER (WHERE status = 'success')    AS successful_runs,
  ROUND(
    100.0 * COUNT(*) FILTER (WHERE status = 'success')
      / NULLIF(COUNT(*), 0),
    2
  ) AS success_rate_pct
FROM cdp_sync_runs
WHERE run_started_at >= CURRENT_DATE - INTERVAL '90 days'
GROUP BY 1, 2
ORDER BY 1, 2;SELECT
destination,
date_trunc('week', run_started_at) AS week,
SUM(rows_attempted) AS rows_attempted,
SUM(rows_synced) AS rows_synced,
ROUND(
100.0 * SUM(rows_synced) / NULLIF(SUM(rows_attempted), 0),
2
) AS row_success_rate_pct
FROM cdp_sync_runs
WHERE run_started_at >= CURRENT_DATE - INTERVAL '90 days'
GROUP BY 1, 2
ORDER BY 1, 2;SELECT
destination,
error_category,
COUNT(*) AS failed_runs,
MAX(run_started_at) AS most_recent_failure
FROM cdp_sync_runs
WHERE status <> 'success'
AND run_started_at >= CURRENT_DATE - INTERVAL '30 days'
GROUP BY 1, 2
ORDER BY failed_runs DESC;Pitfalls
Where this metric applies
- Segment + Metabase — warehouse and destination sync monitoring
- RudderStack + Metabase — event delivery and sync health
- Hightouch + Metabase — reverse-ETL run
logs from
hightouch_audittables - Customer.io + Metabase — audience and journey data feeding lifecycle sends
Related
Analytics
Dashboards & metrics
FAQ
What's a good sync success rate?
Should I measure runs or rows?
rows_synced ÷ rows_attempted alongside the run rate.Where does sync run data come from?
hightouch_audit tables, and warehouse-connected CDPs like Segment and RudderStack expose sync metadata through their APIs and monitoring exports. Land whatever run-level log the tool offers and model it into one cdp_sync_runs table.