‧
6 min read
How to create and analyze an NPS survey the right way
The Metabase Team
‧ 6 min read

Share this article
Net Promoter Score (NPS) is a metric used to gauge customer loyalty, or how likely a customer is to recommend your business, product, or service to others. In an NPS survey, customers rate their likelihood to recommend on a scale of 1-10. A customer is considered a Promoter if they give a score of 9-10, Passive, 7-8, or Detractor, 0-6. While knowing whether a customer is promoting your products is helpful, it’s even more helpful to know why they are promoting it.
The score itself is the least crucial part of NPS survey results. Many data scholars agree that the score can’t really project actual outcomes for customers and companies, but the survey responses can help you understand how your customers are using and thinking about your products and services.
Asking specific questions in NPS surveys is a great way to understand individual customer goals, and help them be successful in the way they want to be successful. Here are a few ways you can start gaining real insights from their feedback, and how to visualize it with data exploration tooling.
Capture reasons for the ratings
There are a few things to keep in mind before creating an NPS survey. A survey is most successful when short and concise. Think about ways to create questions that guide your customers into giving the best response.
Rating systems in surveys can be subjective, so try to ask clear, direct questions for precise answers to why your customers are choosing a number as their rating. You can also ask follow-up questions about personal goals to give more context to their rating.
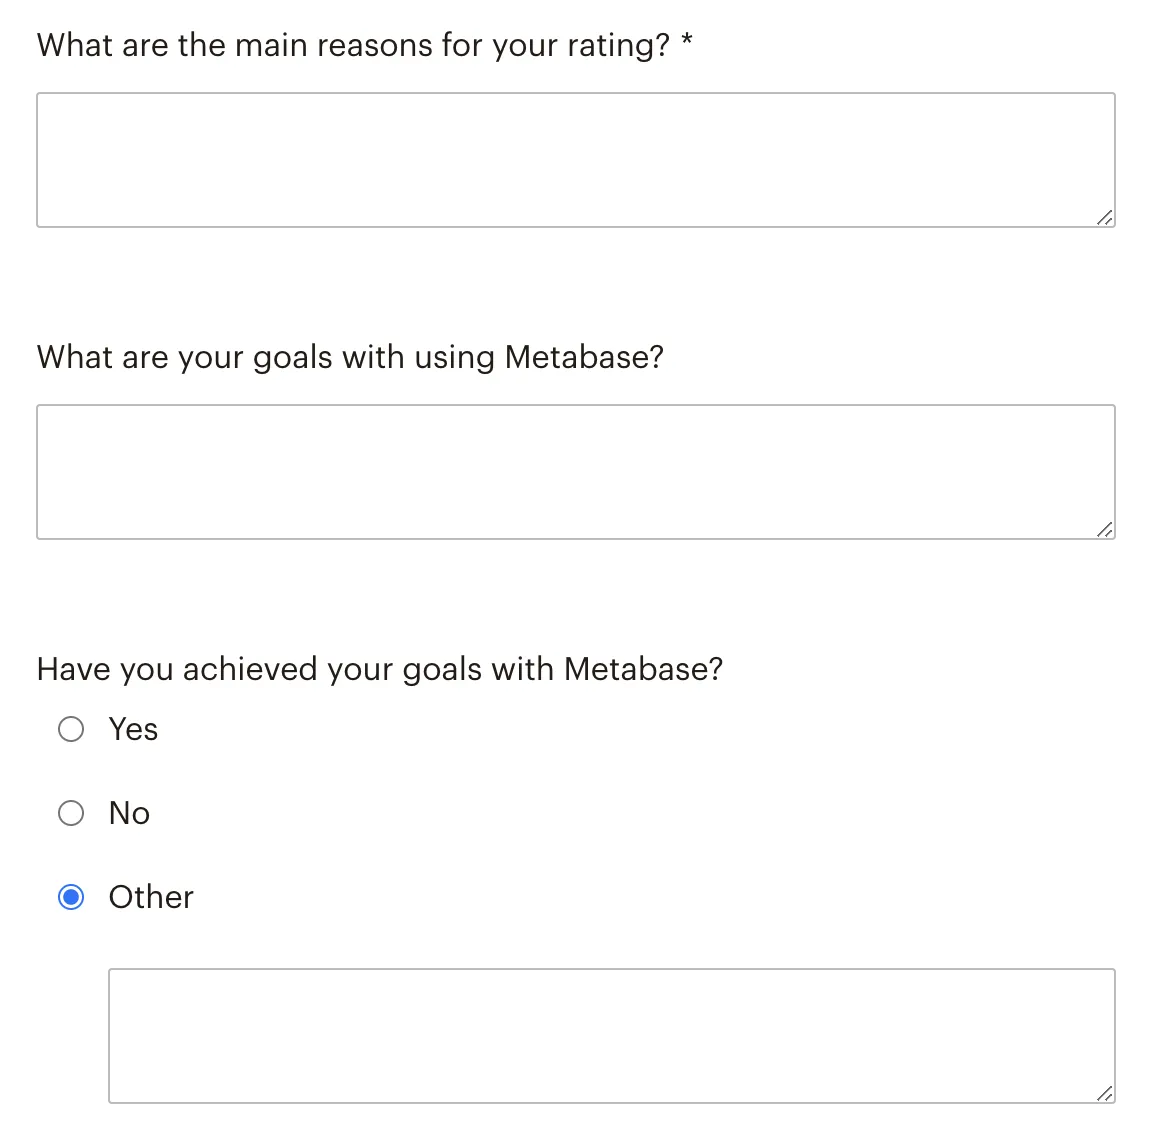
The general question for most NPS surveys is, “How likely are you to recommend our product or service to a friend or colleague?”. The two questions we’ve found to be the most valuable to follow up with are:
- “What is your reason for this rating?”
- “What are your goals with [the product or service]?”
Other questions you can ask include, “How did you find out about the product/service” or “Did someone recommend you this product/service?” Figuring out how customers are finding your product or service is helpful in determining how to communicate with them, and how they may communicate with others, especially if they’re recommending your product or service.
For example, if most of your customers found out about your business through social media, you can start using social media as a channel to communicate new features, services, and gain additional insights.
Decide how and when to send the survey based on behaviors
When and how to send the survey really depends on your customers. Finding out what drives them to respond to a survey based on time and format is just as important as the questions you ask.
Think about how often your ideal customer is engaging with your product or service. Is your product a daily use SaaS platform? Are customers coming to your store once a month, or maybe once a quarter? Take some time to track how often and when your customers are using your product or service to find the best times to send.
Here’s a few other questions you can ask yourself to get a clearer sense of direction for your NPS survey:
- Where do we want the survey to live? On our website? Within the product? Sent by email?
- If we’re sending by email, how often do we want to send the survey?
What you definitely want to avoid is pestering people with surveys. Just because you got a response from the first survey you sent out to someone doesn’t mean they’ll respond the next time you send out a survey.
Build your NPS survey
Once you have asked yourself the important questions, you can start building your NPS survey. If you’re a small business and are looking for a lightweight, cost-efficient way to build an NPS survey, Google Forms is a good option. You can generally track customer responses easily, and export the data to visualize responses in different platforms. Typeform also offers free NPS templating.
There are several paid platforms. We like to use Mailchimp, but there is also Qualtrics, SurveyMonkey, and Hotjar, which offer NPS-specific products geared toward streamlining survey creation, maintenance, and integration with other platforms.
Store the results in a database
To get started, store your survey results in a database and connect it to Metabase (or whatever tool you use to explore data). You can also use ETL tooling to integrate between your platform and database.
As an example, if you’re using Google Forms to store the results, you can view your results in a Google Sheet, and add that sheet as an external table in BigQuery. You can then connect BigQuery with Metabase and start visualizing the results.
Analyze the results
Here’s an example of the query we use in Metabase’s query builder to find our NPS score and organize the responses. First, we select the data source with columns containing the survey questions, like “How Likely Are You To Recommend Metabase”, org ID, org name, and additional customer information. We also create a custom column to determine NPS disposition (whether the respondent is a promoter, passive, or detractor).
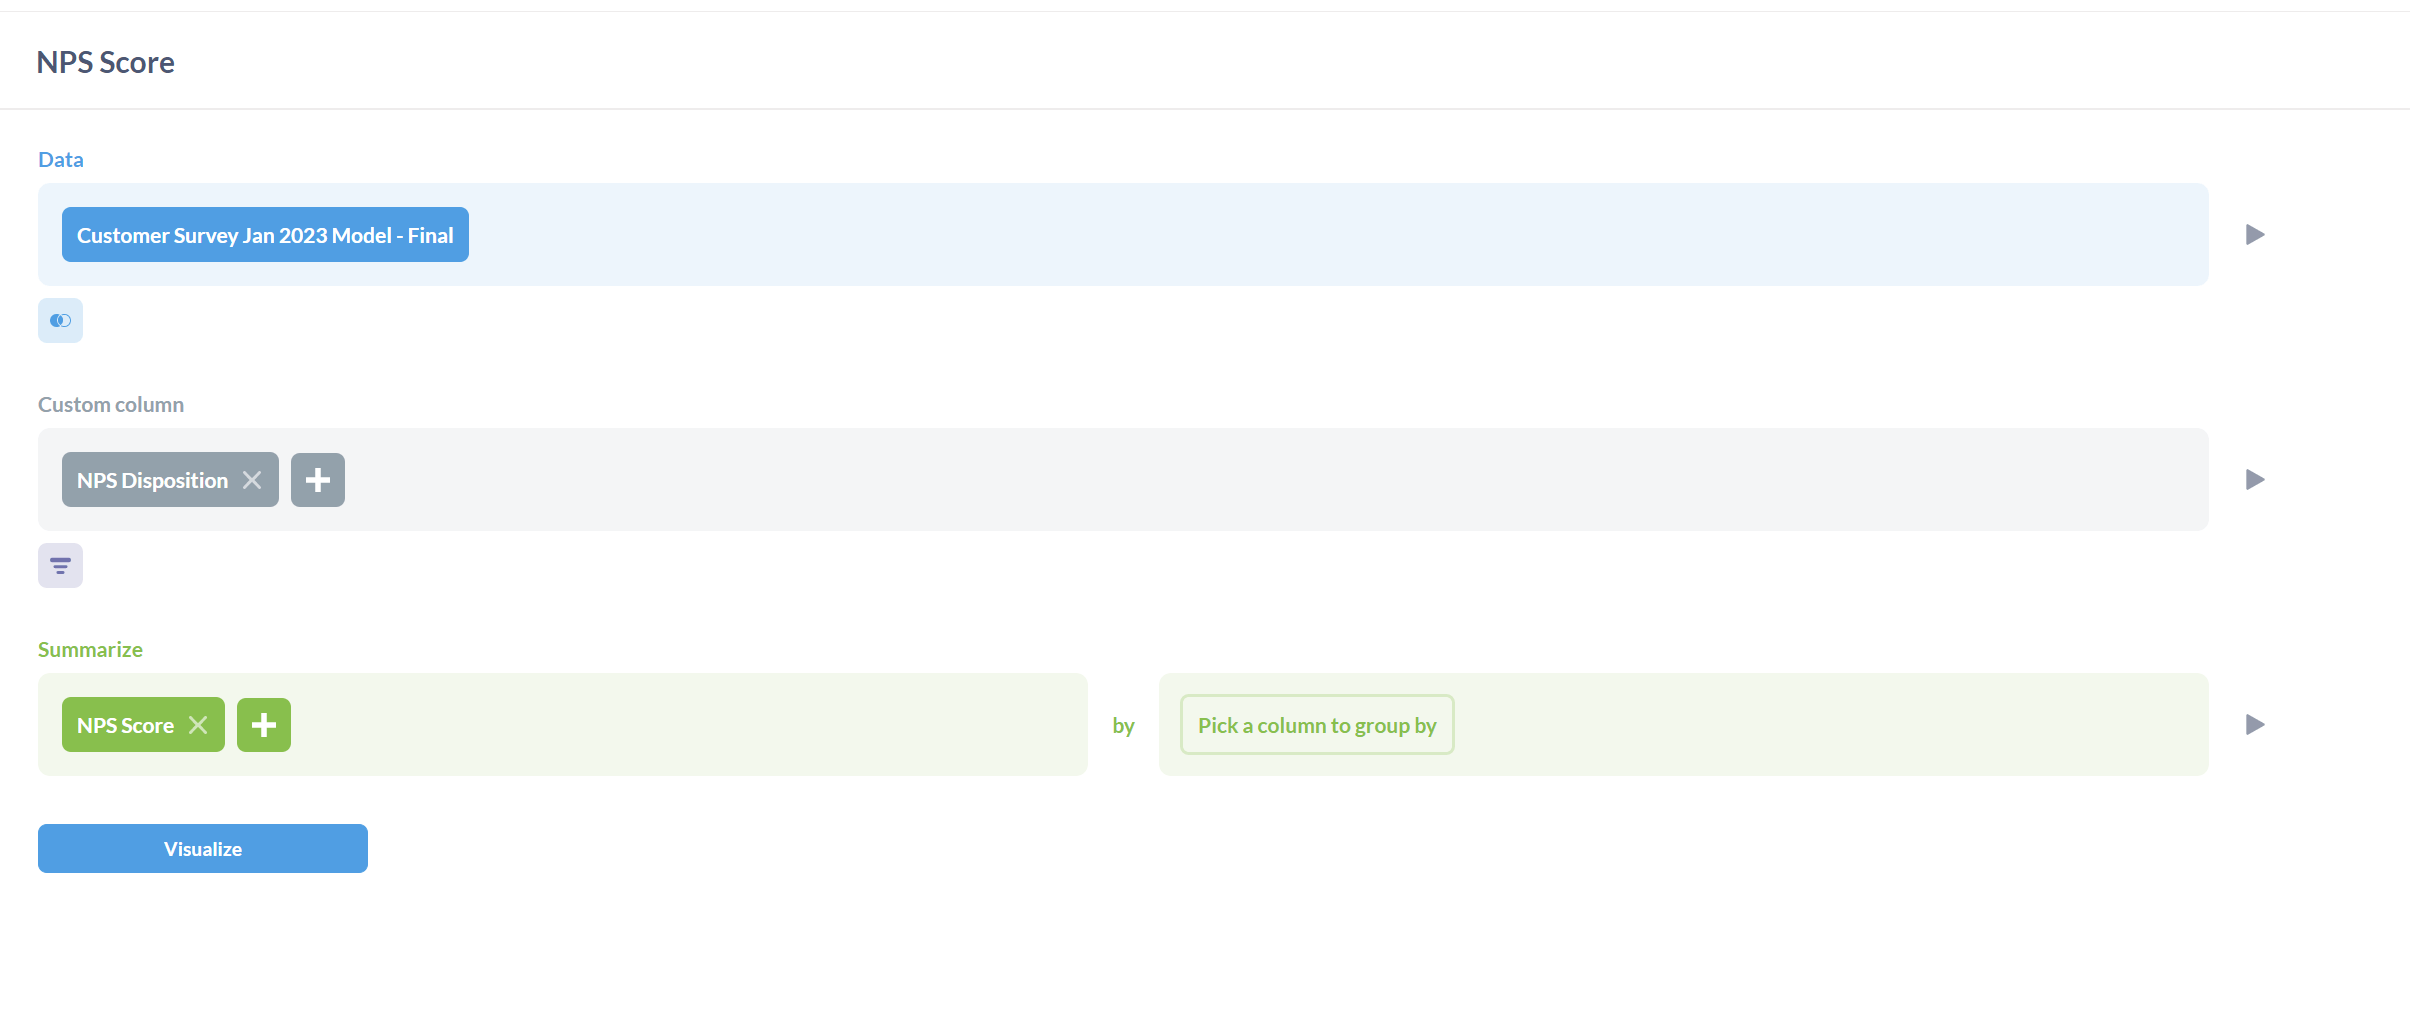
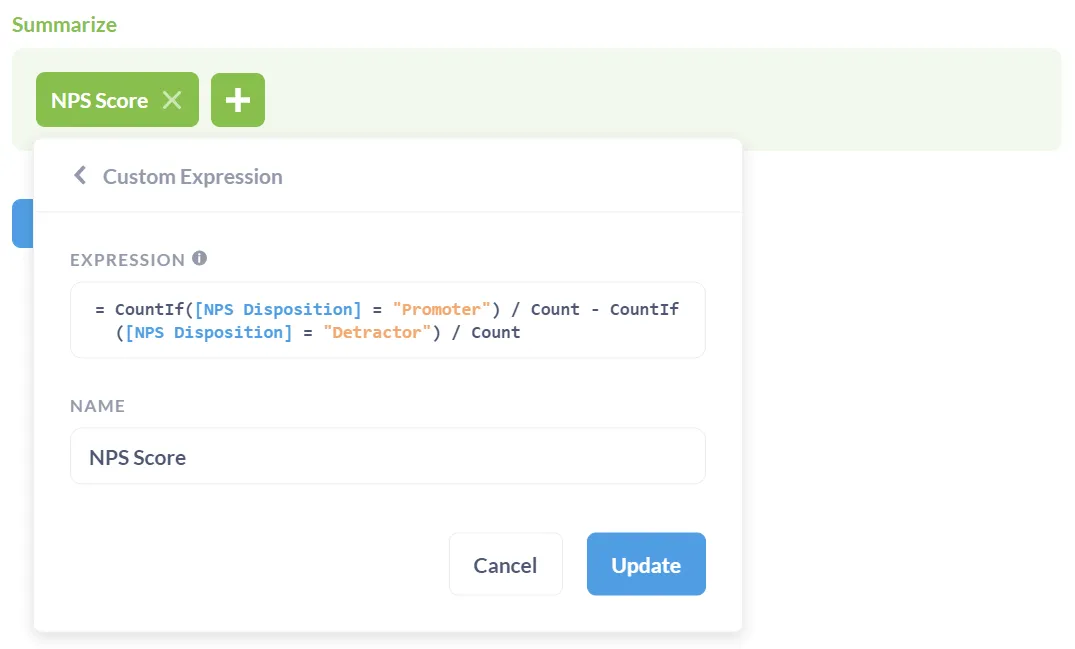
This custom column has a custom expression to calculate the NPS score.
CountIf([NPS Disposition] = "Promoter") / Count - CountIf([NPS Disposition] = "Detractor") / Count
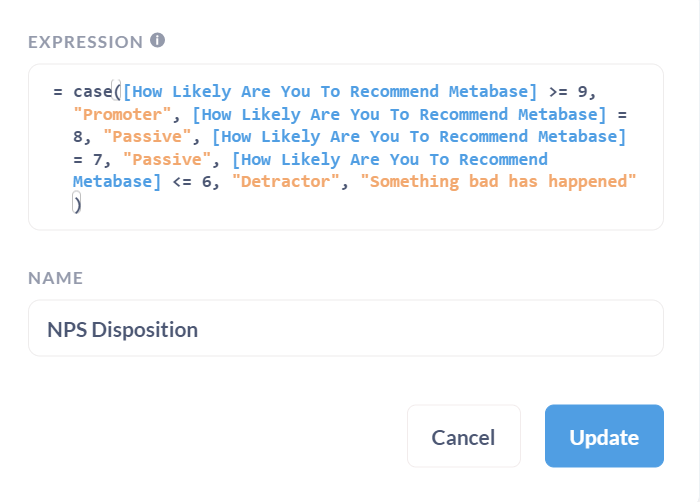
To summarize NPS score, we create an additional custom expression to designate score by Promoter, Passive, or Detractor.
case([How Likely Are You To Recommend Metabase] >= 9, "Promoter", [How Likely Are You To Recommend Metabase] = 8, "Passive", [How Likely Are You To Recommend Metabase] = 7, "Passive", [How Likely Are You To Recommend Metabase] <= 6, "Detractor", "Something bad has happened")
We regularly use this question to build a narrative dashboard and analyze NPS results. This type of dashboard bridges the gap between qualitative and quantitative analysis in one space, but you can create any dashboard to track patterns in customer responses.
For example, our current narrative dashboard has an NPS survey overview in markdown for information on who we surveyed, when we surveyed, and what we’re finding in the results. And the dashboard includes dynamic text to allow filtering on exact measurements, like scores of 9 and 10 and why we were given that score.
The end goal of the narrative dashboard is to articulate what the customers really think about your product. Keep asking yourself follow-up questions to find answers: are the detractors in a specific industry? What features do the promoters focus on? Why are people in this service area usually passive? The more direct questions you ask yourself and your customers, the easier it’ll be to see what their version of success look like, and how can you help them get there.