4 min read
‧ 4 min read

Metabase usage analytics is the new version of auditing tools on Pro and Enterprise plans, available as a collection of interactive dashboards, questions, and models built on your usage data.
With Metabase usage analytics you can see:
This guide gives a few real-world examples of how you can take advantage of these usage analytics.
There are many factors that may determine how you use usage analytics, like industry standards and regulations, team and org size, structure, etc. This guide isn’t a specific set of rules, so feel free to take these ideas and build on them for your use case.
Our data team uses Metabase usage analytics to track and monitor question and dashboard usage and performance to ensure things run smoothly. Usage analytics allows the team to track which questions people view the most (e.g. Seeing if their latest activation models are being used in questions).
The prebuilt Most viewed content dashboard lets you filter by group name. Once you know what people are most interested in viewing, you can structure your Metabase so that the most used stuff is more discoverable, like by putting certain metrics on your Metabase home page.
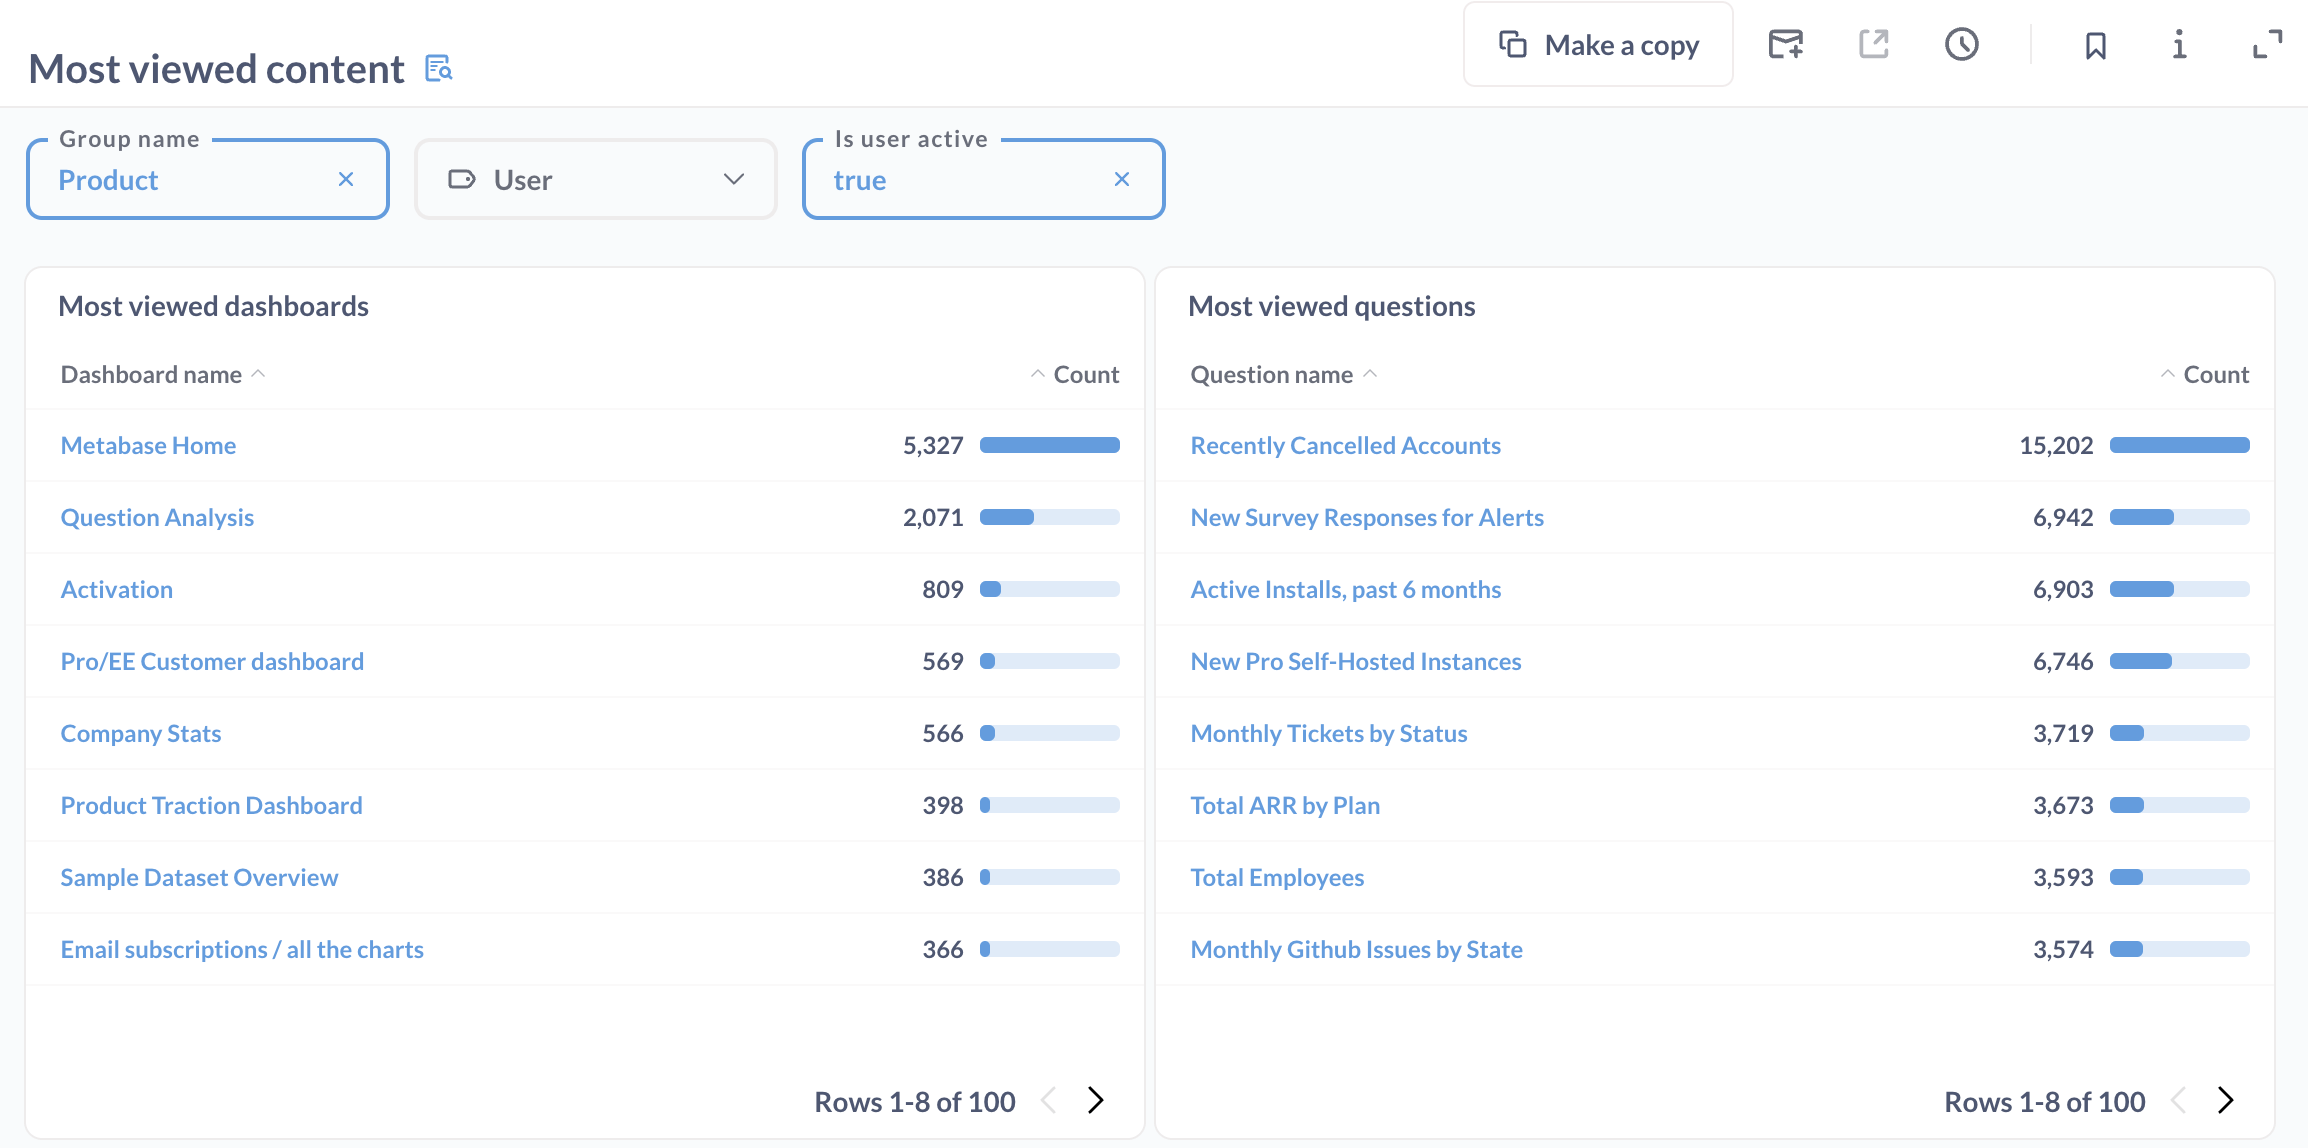
You can also set up as a dashboard subscription to a Slack #general channel to send relevant data to your teammates.
We use usage analytics to find out which dashboards or questions are no longer being used and retire them. To see this, take a look in the Content with cobwebs prebuilt dashboard and archive unused content.
We also use usage analytics to find dashboard questions that take a long time to load and refactor or cache results. To see this yourself, go to the Performance overview prebuilt dashboard for a full overview of your slowest content.
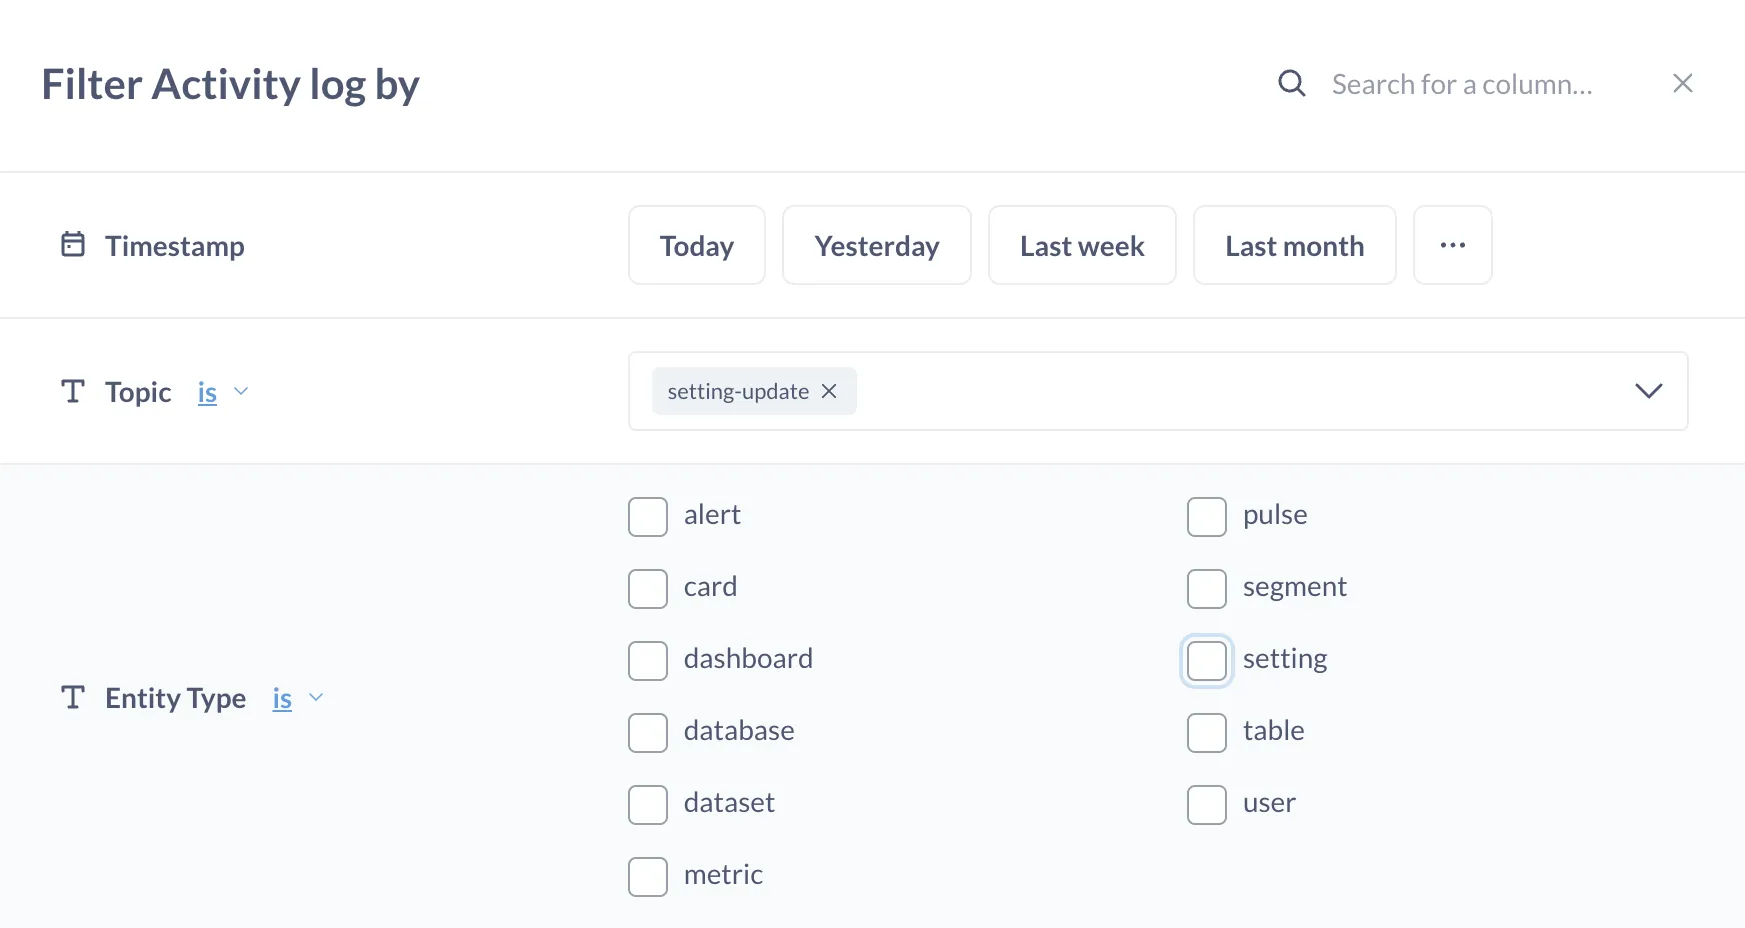
We track changes to configurations and settings, like that time someone changed the language of our instance from English to Brazilian Portuguese, or disabled Google single sign-on.
To see changes to settings, you can go to the activity log model, and filter on setting-update. You can continue to keep tabs on them without living in Metabase by setting up subscriptions or alerts if something changes.
We use Metabase for compliance, auditing, and monitoring data security. It’s important to note that the definition of what we do can look very different compared to other organizations. How you use usage analytics in this situation can vary greatly depending on scale, industry, and the needs of your organization.
For Metabase, we’re mainly focused on SOC2 Type 2 compliance. We want to know who has access to what, whether that access is really needed. If not, we change the account’s permissions, or deactivate the account entirely.
For example, your IT team could use usage analytics when offboarding team members or restricting access by teams. Having an overview of data access available in Metabase helps us ensure that each person is mapped to the correct user group and has the right access levels and permissions.
To view which groups a person belongs to, go to Person Overview dashboard. You can filter on a person’s name, email, or user ID, looking specifically at date range, activity type, query source, and more. The dashboard includes details about the person, groups they belong to, how many questions and dashboard they’re viewing month over month, and what they’re looking at.
The Metabase analytics collection also comes with audit logs to help you understand who is downloading and accessing your data. For example, the UI only allows you to see up to 10k rows of data, but in audit logs you can see if someone downloaded 1M rows of data.
Audit logs are a feature we’ve used as part of our incident recovery plan. For example, if someone sees or does something on accident, audit logs lets us know what happened so we can prevent it from happening again. We report on any kind of data breaches as they occur, so any data we have to investigate and provide context is helpful.
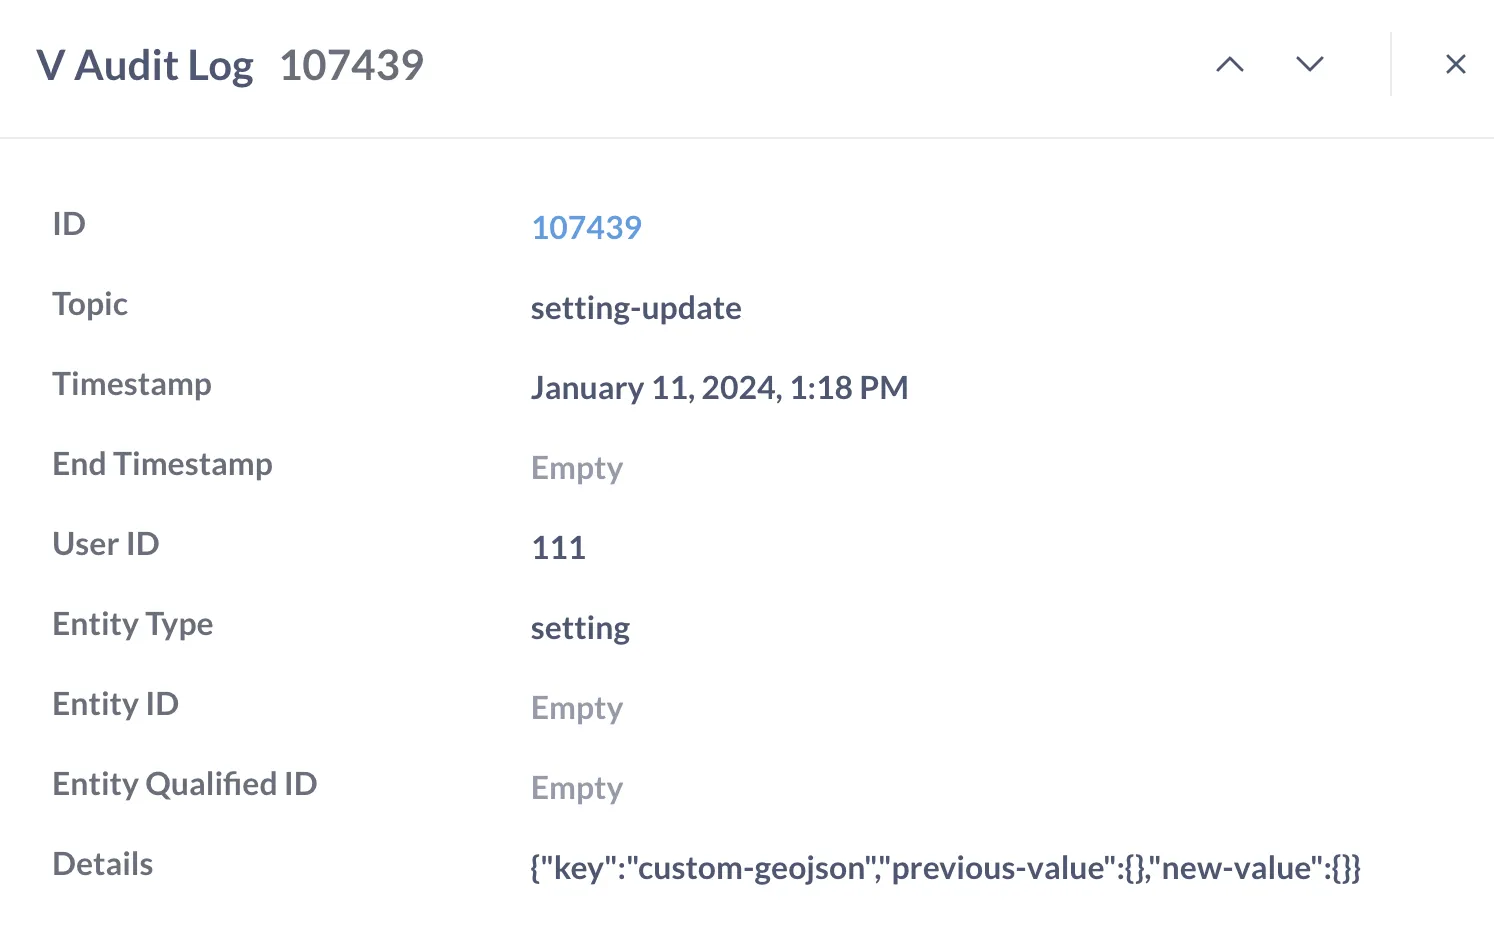
To view audit logs, you can go to the Metabase analytics collection and click on any of the log models under Useful data. For example, you can view the Activity Log and click on any ID to see the audit log details.
You can get to Metabase usage analytics by clicking on “Metabase analytics” under your collections. Try out any of these use cases, or come up with your own workflow.
 Feb 26, 2024 in Using Metabase
 Get the customer data and insights you need automatically filtered and ready for use within your support tickets. You can also embed a dashboard in Salesforce, Stripe, Jira, or platforms that allow embedding URLs.
‧ 5 min read