‧
8 min read
Metabase housekeeping with usage analytics
The Metabase Team
‧ 8 min read
Share this article
Metabase usage analytics is an investigative tool you can use to find errors and troubleshoot faster; clean up your Metabase instance. It’s available for Pro and Enterprise plans as a collection of interactive dashboards, questions, and models built on your usage data.
A cool thing about usage analytics is you can filter by user group to see what’s not being used by people in different departments and work backwards to figure out how to guide them to what’s relevant to them.
Here are some ways we recommend using usage analytics to keep your Metabase tidy, organized, and running smooth.
Find and remove (or repurpose) unused dashboards and questions
People do ad hoc analyses, save those questions and dashboards, and then forget about them, which can clutter your instance. Archiving unused questions gets them out of the way so people don’t accidentally work with outdated data.
Unused content may also be a sign that important, relevant content is hard for people to find. For example, your finance team isn’t intentionally ignoring that dashboard you made specifically for them, they just can’t find their way back to it.
Knowing what’s not being used can also come in handy when you need to prioritize new projects. For example, the marketing team is asking for a new dashboard, but a quick check shows that the last dashboard you made for them was only used once, so a one-off analysis project might be more suitable.
How to see what’s unused in Metabase Analytics: Look at the Content with Cobwebs dashboard. This is a premade dashboard where you can see which of your dashboards and questions haven’t been used in a while.
What to do about it: In the Content with Cobwebs dashboard, you can see what content each user group or department isn’t using, and archive any unused dashboards or questions to minimize clutter.
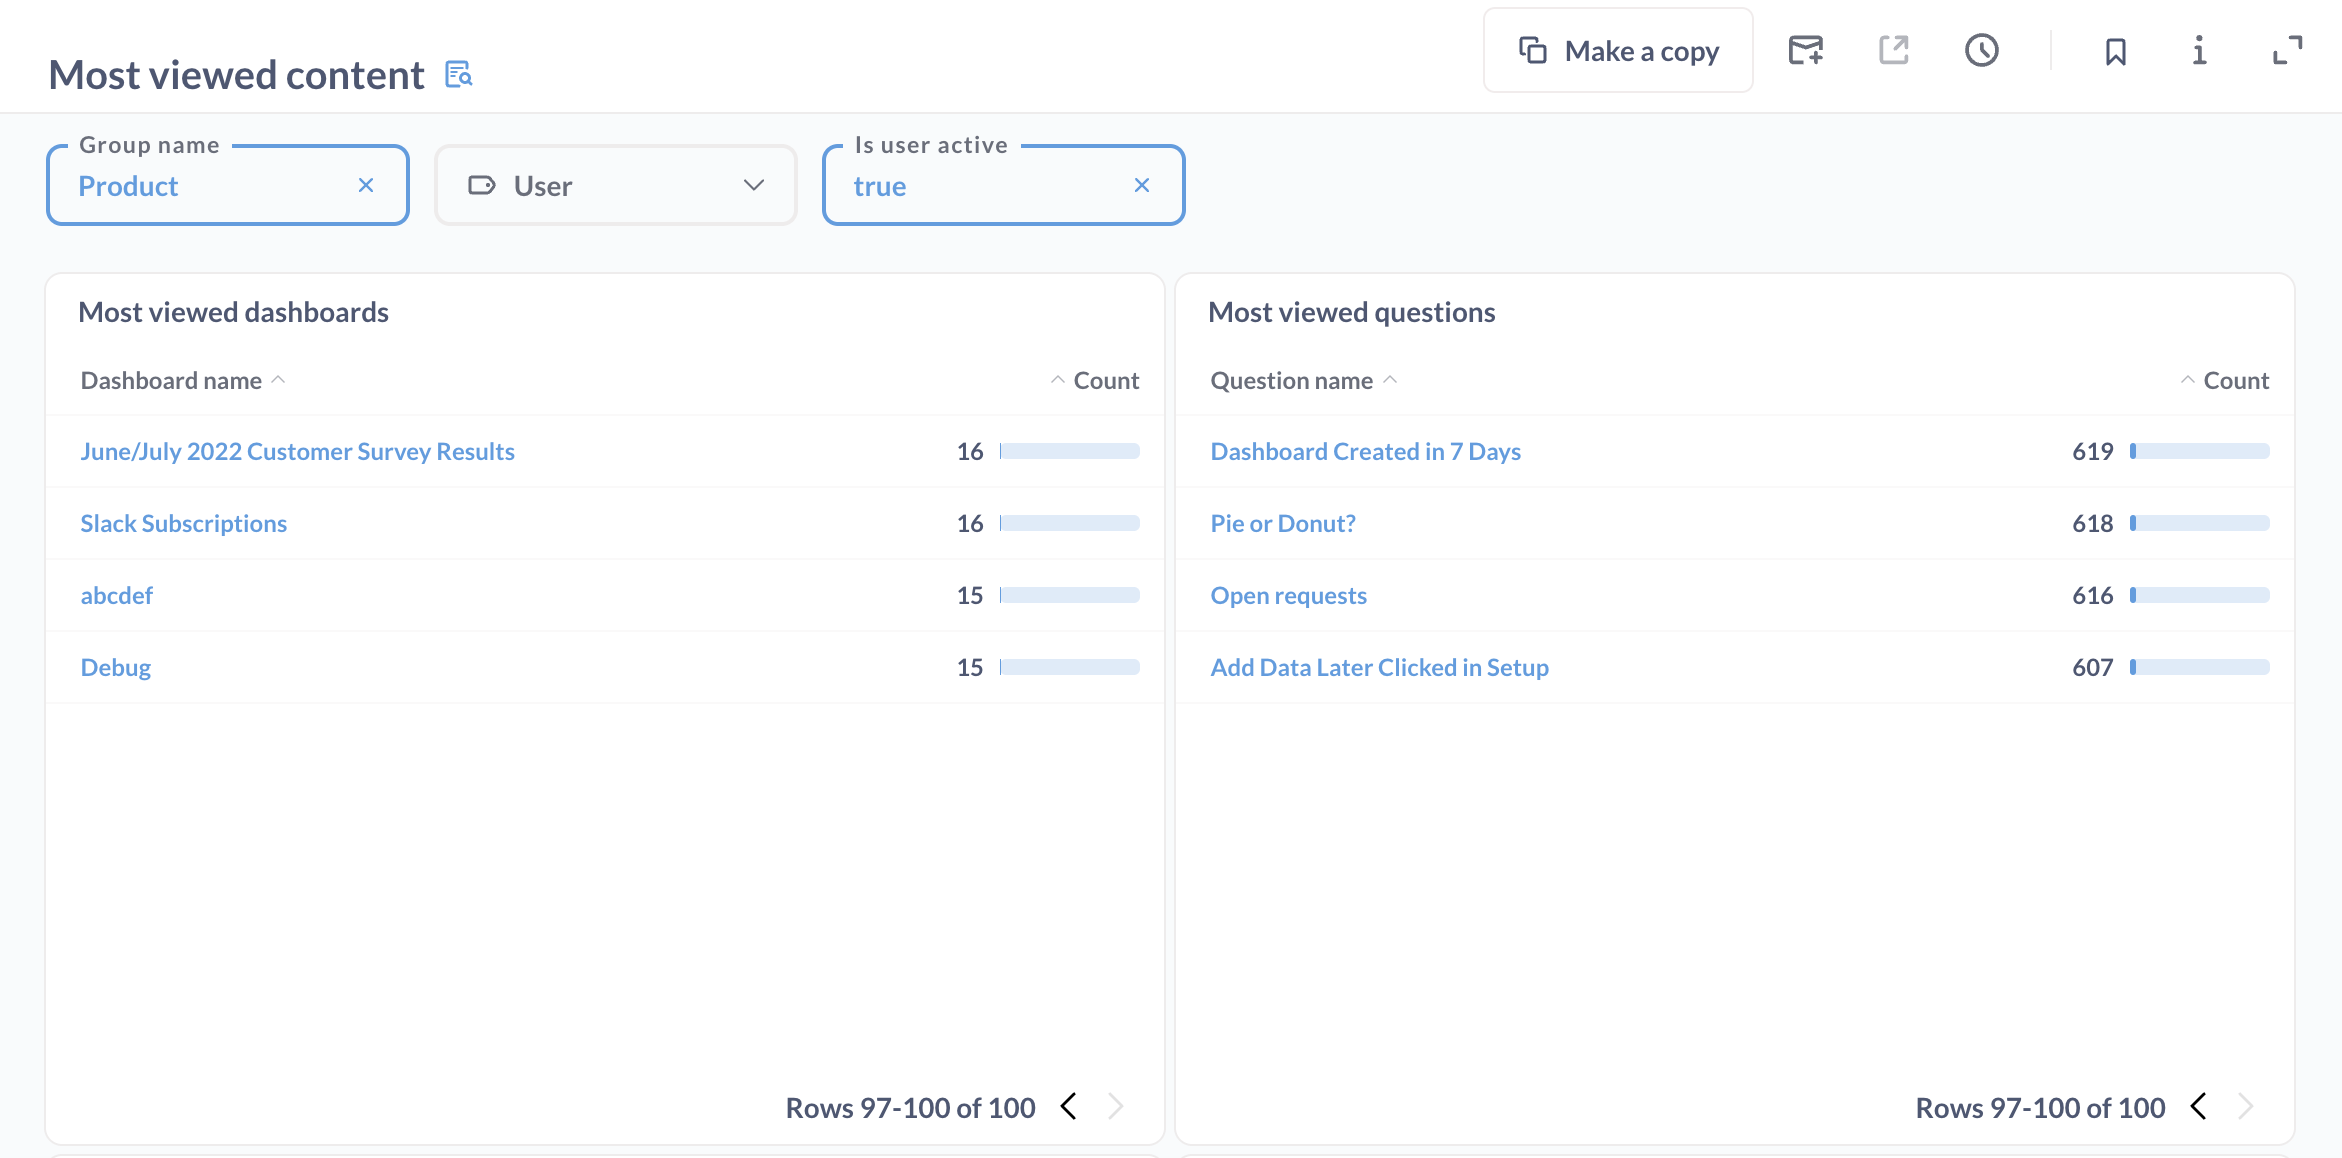
If you notice in your usage analytics that some things aren’t really being used, make them easier to discover and reference. You can customize your Metabase homepage with any dashboard so people can immediately get the info they need. You can also make your data more searchable by surfacing indexed records, or use official collections and verified models and questions (if you’re on a Pro or Enterprise plan) to point people to where they need to be.
Find cards on dashboards that are showing errors
Minimize frustration and dead ends by finding dashboards that show errors and figure out which ones needs to be refactored or retired.
How to find cards that are returning errors on dashboards: View the Query Log and filter on Query source is dashboard and Error is not empty to see which cards aren’t working as expected, and either fix or remove them.
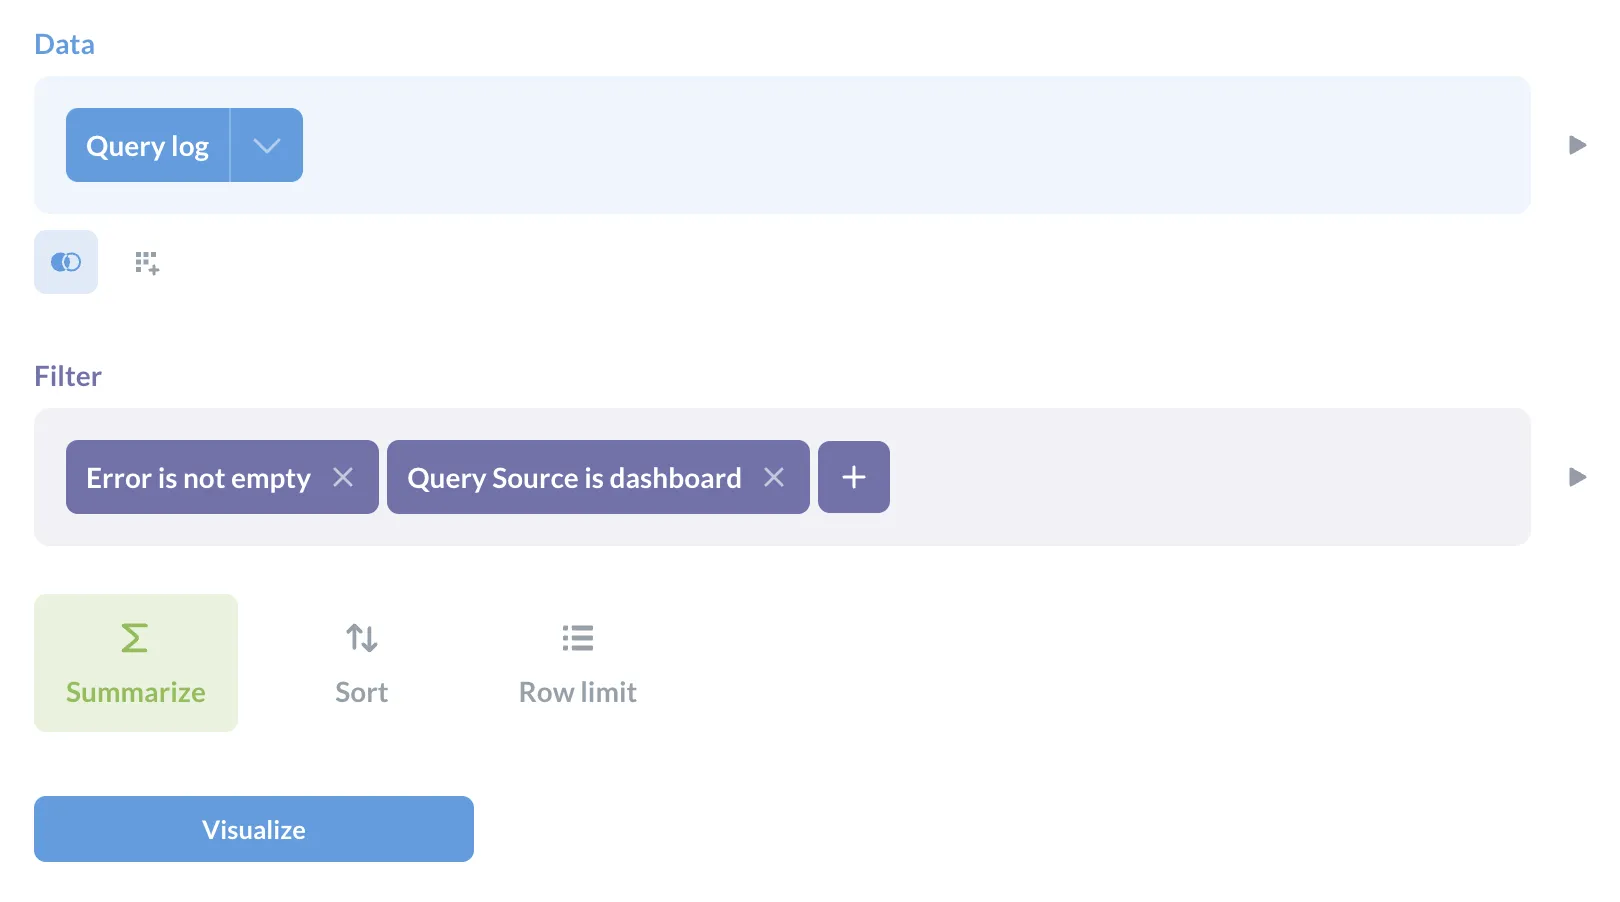
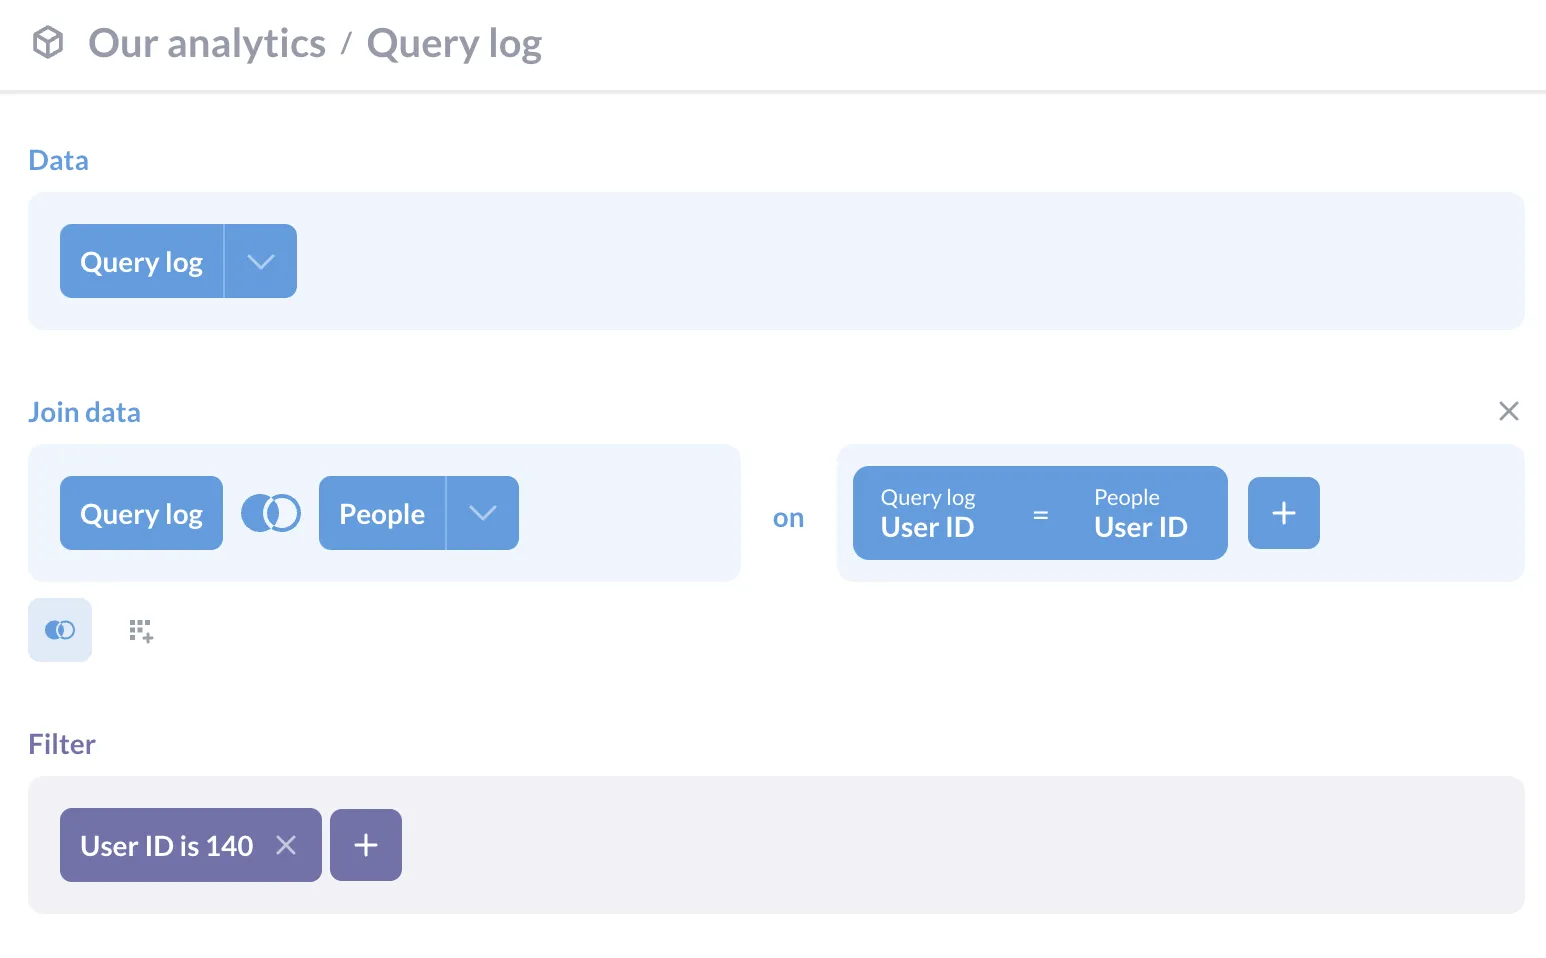
What to do about it: The Query log will often show the reason for the error so you know how to fix it. For example, ERROR: syntax error at or near "left" Position: 121. You can also join this log with the people model on user ID to trace dashboards and cards back to their creators, that way you can ask if they’re still in use.
See which outdated dashboards and questions are being used (when they probably shouldn’t be)
Some dashboards and questions will be evergreen, updating automatically with freshly ingested data. But it can be useful to routinely check that people aren’t using outdated questions or dashboards. Same goes for tables and models.
How to check for dated dashboards and questions: In the query builder, join the View Log and Content models on qualified ID, and filter on what’s been viewed recently, and created over a year ago (or more or less depending on what you’d consider ‘outdated’ in your org).
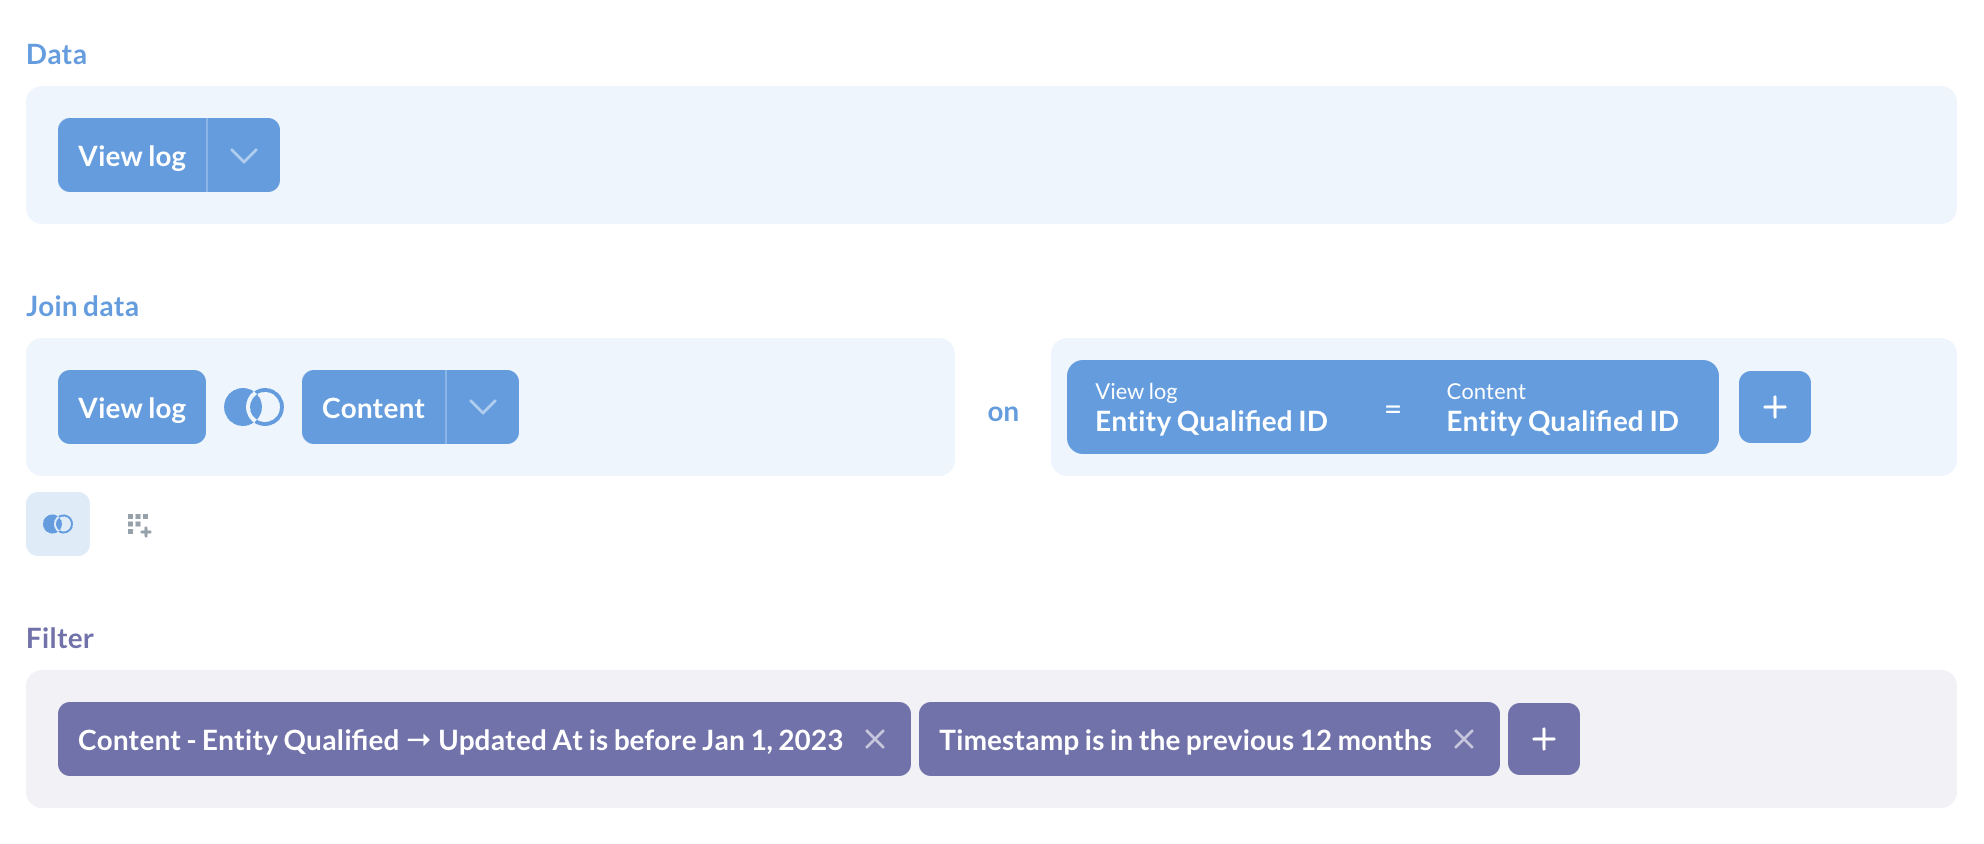
What to do about it: Find out if the content is still relevant, and if not consider archiving it, or recreating the content with a fresher data source. Mark vetted content as verified (and let your team know) so they’re using trustworthy data.
Find slow dashboards and questions
Time is literally money when it comes to long-running queries and your data warehouse. Dashboards and questions that take a long time to load are a pain for everyone, and discourage people from self-serving.
How to find slow content: View the Performance overview dashboard. Info on Dashboards, Questions, Databases and Users are divided into tabs. Within each tab, you can filter on database and user group, and view specific records. For example, for the slowest dashboards, click into a dashboard and select ‘See these Query logs’ in the action menu.
How to fix it: You can investigate why the dashboard is slow. The optimal number of cards on a dashboard is 20-25, more than that will slow load time. Use tabs to split up dashboard content to speed things along while also making it easier to consume for people. For questions, you may want to look at optimizing or refactoring queries.
You can also cache results (and get hyper specific about what to cache and for how long if you’re using Metabase Pro) or decide if it’s time to archive old content.
Managing users: deactivating old accounts, following up with inactive users
We want everyone to get the most out of Metabase, and to not have to pay for seats that aren’t being used. If a user hasn’t logged in for a few weeks, or never logged in again after the first time, they’re probably not getting that much out of having access to your Metabase. These people may need some extra help to find what they need, or it may be that their account can be safely deactivated.
If someone’s left your organization but you’re not sure that their account has been deactivated by you or another admin, you can do a quick check in the People model.
How to check inactive users: In the People model, filter on users that are Active. This is any user who has current access / a paid license to your instance. From here, you can filter on anyone whose last login is more than six months ago (or more, or less, depending on your preference). You could also check for people whose last login matches the date they joined.
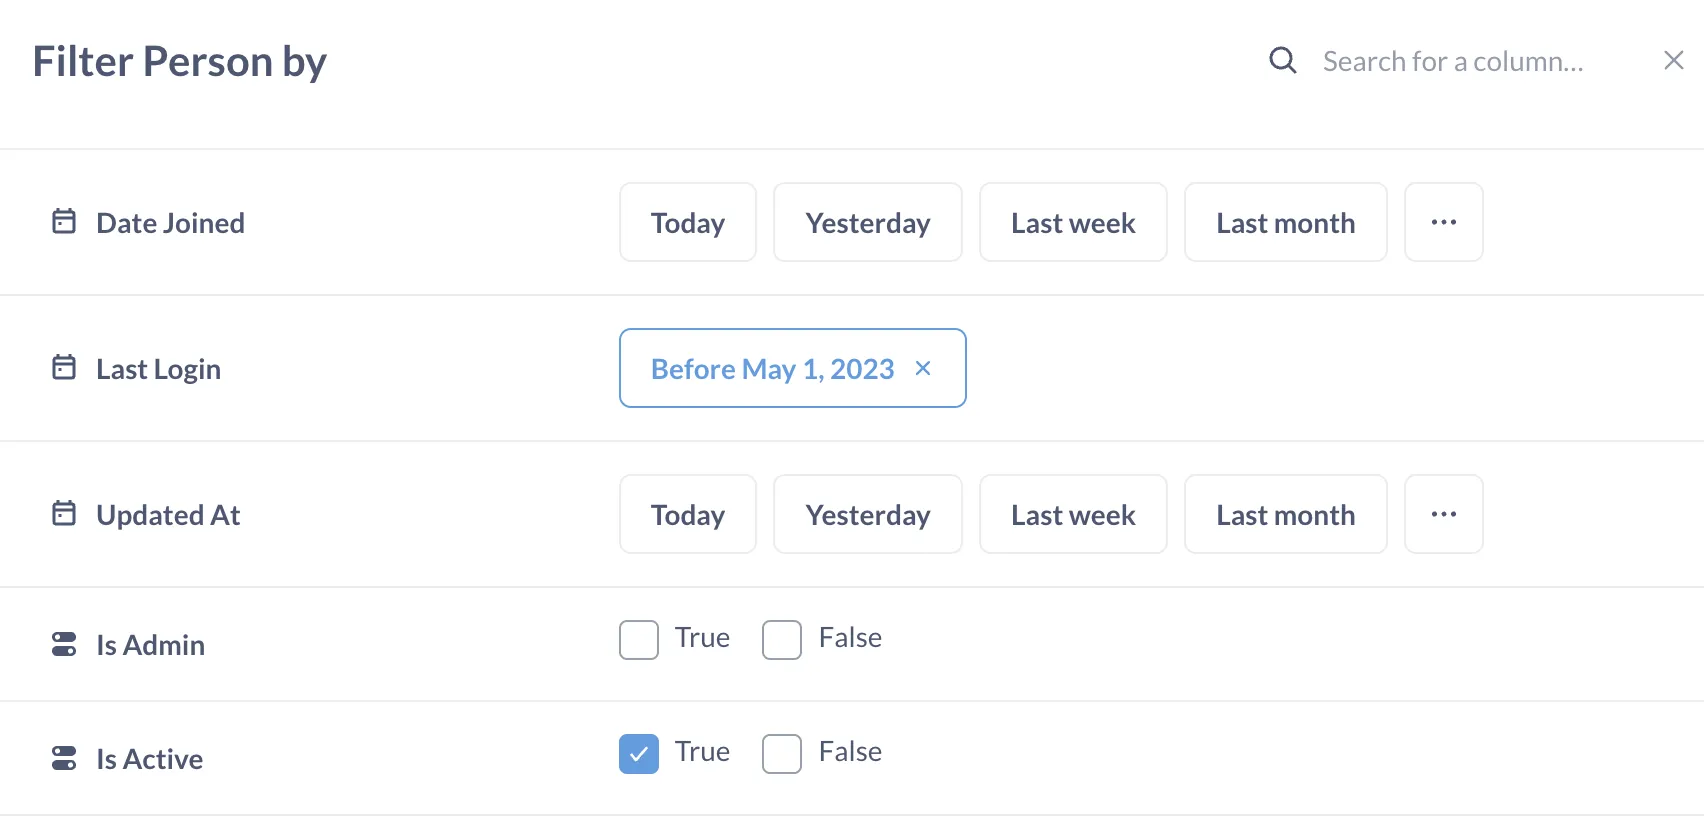
What to do about it: Check in with people who haven’t logged in for a while. See if they need help with using Metabase or accessing the right data, questions, or dashboard. If they no longer have a use for Metabase, you can deactivate their account.
Find what’s consuming the most resources
Your Metabase can also be slowed down by dashboards and questions that are taking a lot of resources. Depending on your database, it may also impact costs. For example, Snowflake charges based on how long queries take to run.
By knowing which questions are putting strain on your database and Metabase, you can take action, like caching results, refactoring queries, or using additional filters to query less data (for example, restricting the date range, or countries).
How to find what’s taking up the most resources: View the Performance Overview dashboard to see which dashboards, questions, and users are using the most resources. View each tab and filter on database or by user to get more insight.
What to do about it: Here’s a performance optimization checklist you can run through.
- Check if dashboards have a lot of questions in the same tab. Consider moving some questions to other tabs or to other dashboards.
- Consider enabling cache for individual dashboards or questions.
- Consider reducing the frequency of the sync and scanning processes.
- You can also check to see if someone left a dashboard in auto-refresh.
- Check if there are any non-relevant, active dashboard subscriptions or alerts.
- Verify if the heaviest questions are hitting indexes or performance optimization mechanisms like partition and clustering columns.
Read more about Metabase usage analytics
You might also enjoy
All posts Feb 26, 2024 in Using Metabase
Embed a Metabase dashboard in Zendesk
Get the customer data and insights you need automatically filtered and ready for use within your support tickets. You can also embed a dashboard in Salesforce, Stripe, Jira, or platforms that allow embedding URLs.
Ignacio Beines Furcada and Sarina Bloodgood
‧
5 min read


