





What goes in a bug & quality dashboard in Metabase?
A bug & quality dashboard tracks the health of the product over time — how many bugs come in, how fast they're fixed, and whether quality is trending up or down. It's the counterweight to throughput: shipping fast means little if defects pile up. Build it from issue-tracker data synced into a database — see Jira or Linear for the connection.
For: Eng leaders, QA, EMs. Refresh: daily.
Source: modeled issues with a type/label for bugs, severity, and created/resolved timestamps.
What does a bug & quality dashboard look like?
Here’s the layout this guide builds: the open backlog and how fast it’s being worked down at the top, then intake against throughput and where bugs are escaping, then the components and individual bugs behind the numbers. Read it weekly to see whether quality is trending up or down.
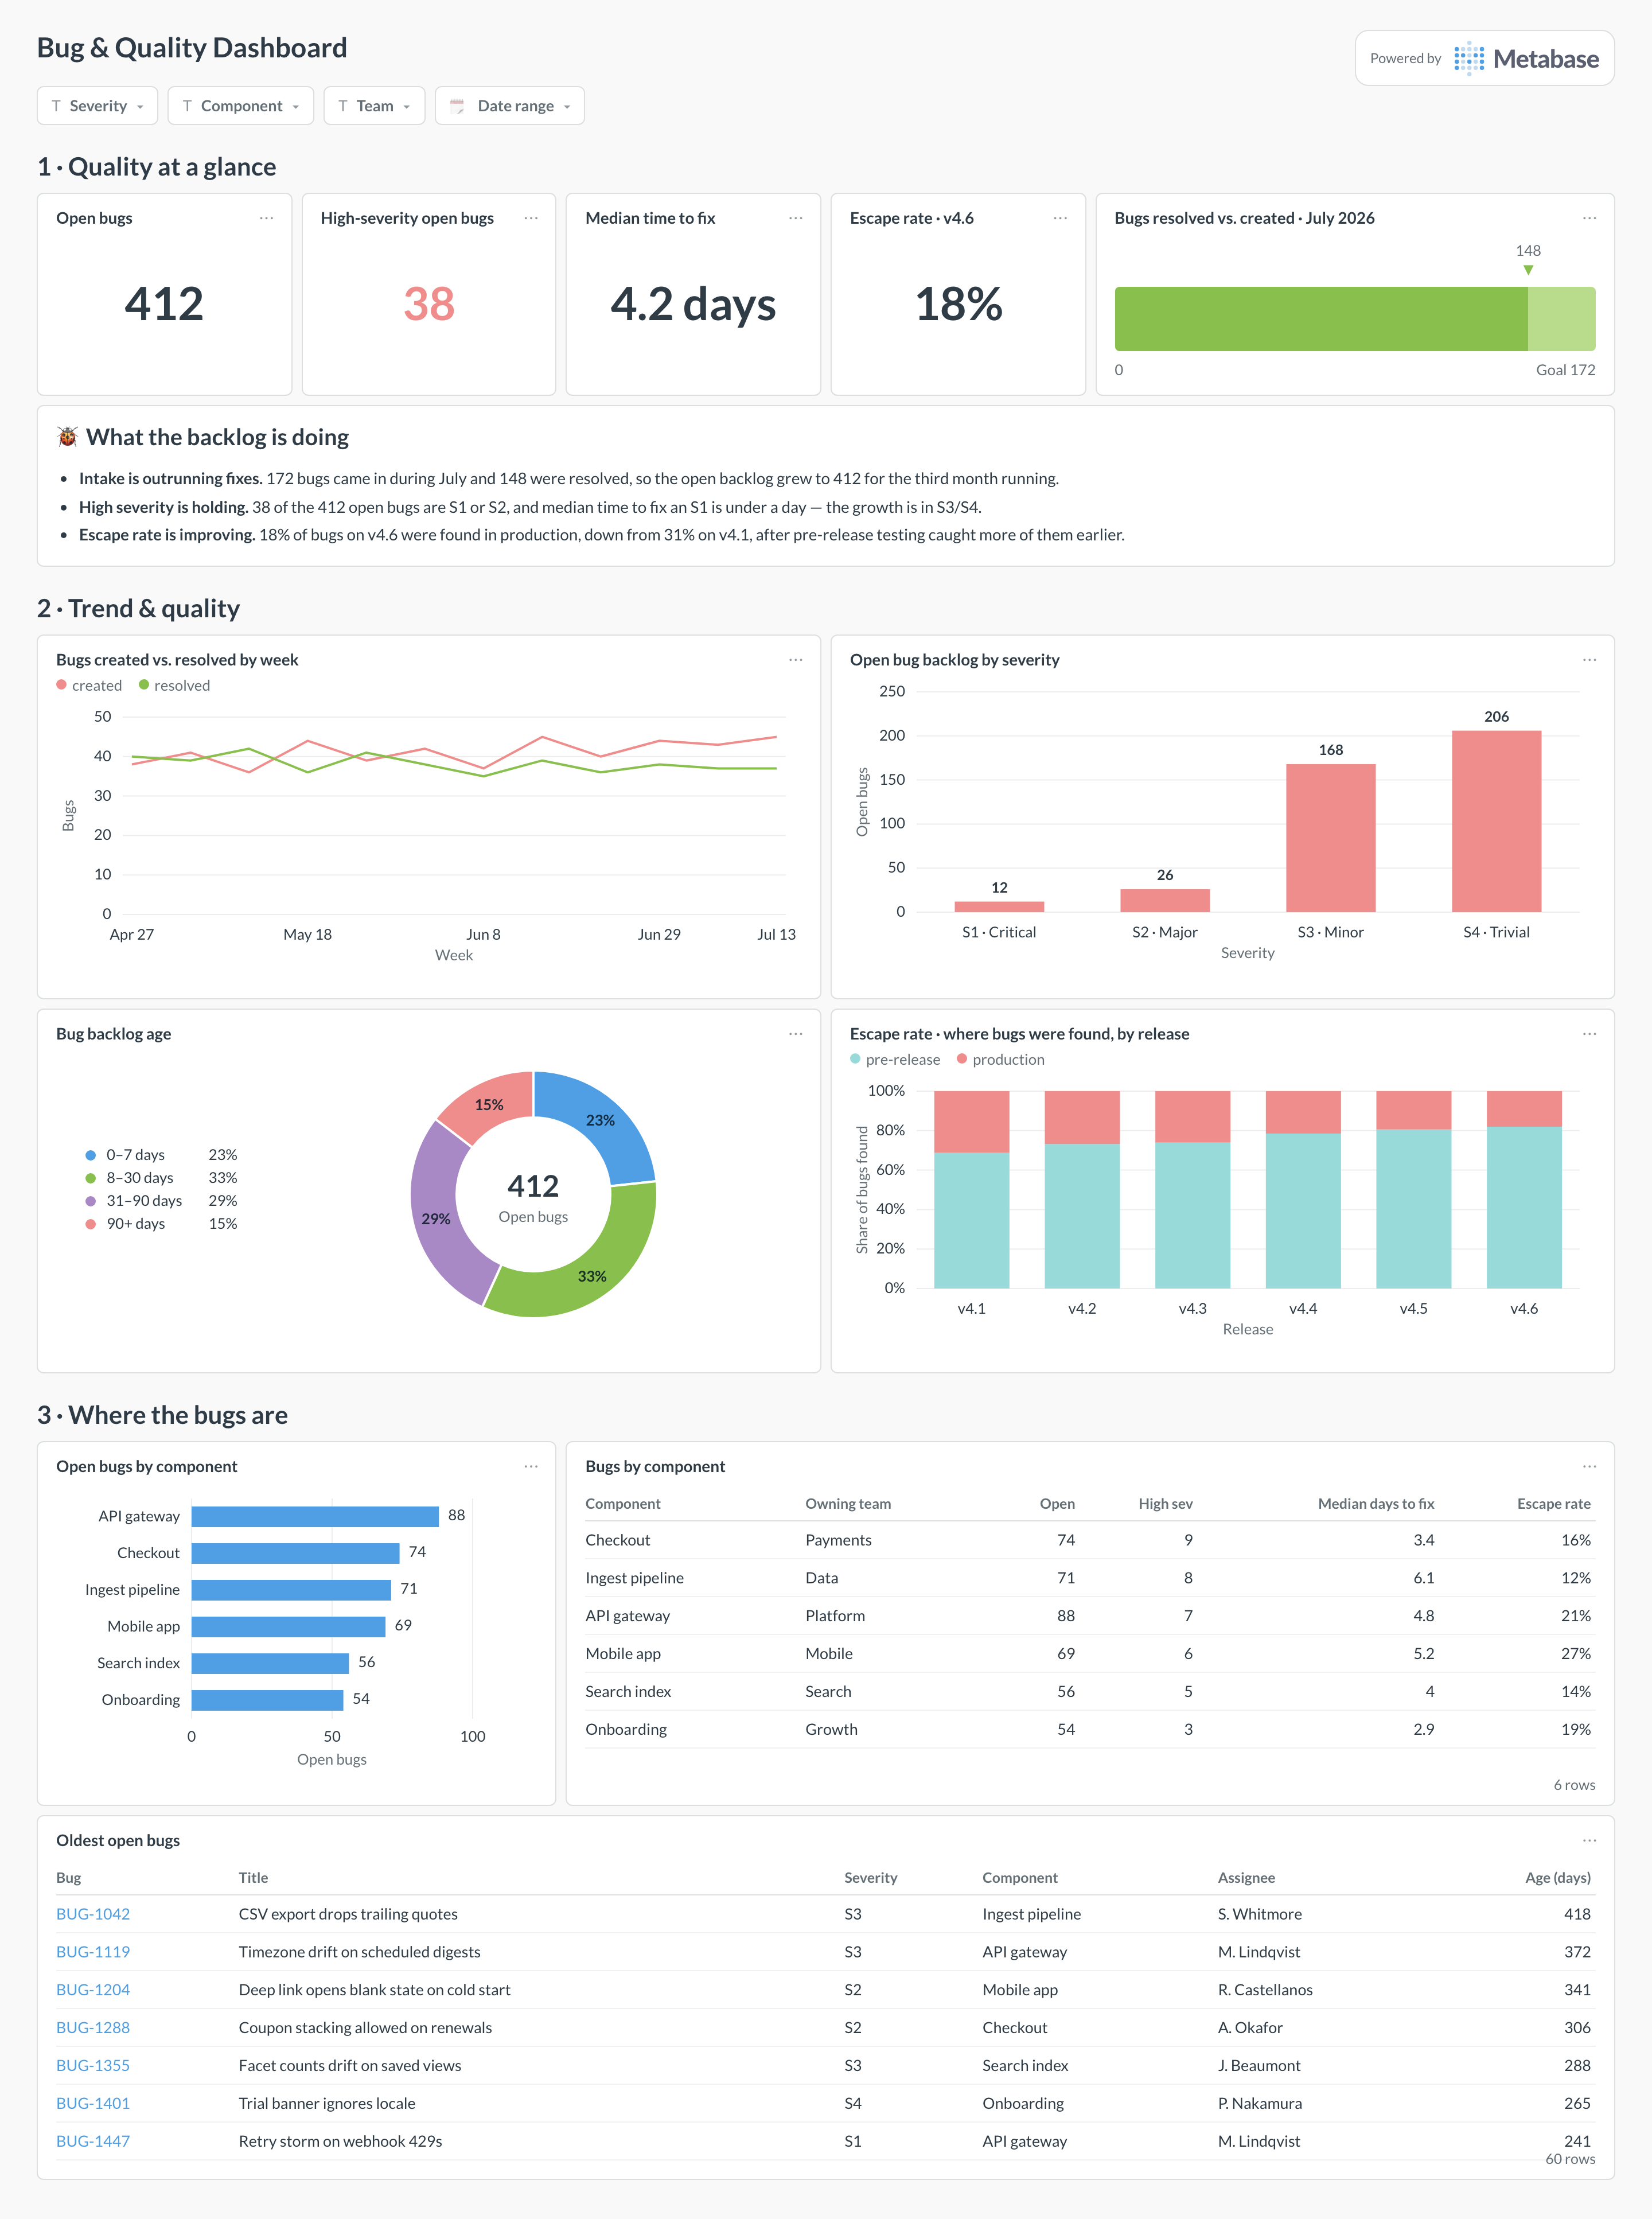
An example bug & quality dashboard in Metabase, built from Jira or Linear issue data. Figures are illustrative.
Which cards belong on a bug & quality dashboard?
Headline KPIs
- Open bugs
- High-severity open bugs
- Bugs created vs. resolved (this period)
- Median time to fix
Trend & quality
- Bugs created vs. resolved by week
- Open bug backlog by severity
- Bug backlog age
- Escape rate — bugs found in production vs. pre-release
- Bugs by component or team (table)
What data does a bug & quality dashboard need?
- A modeled
issuestable with a bug type/label, severity, and created/resolved timestamps. - A component/area and team field for breakdowns.
- An environment or stage (pre-release vs. production) if you want escape rate.
How do you build a bug & quality dashboard?
- Sync your tracker into a database (Jira or Linear).
- Model issues; identify bugs by type/label and normalize severity.
- Build created-vs-resolved, backlog-by-severity, and time-to-fix cards.
- Add filters for severity, component, and date range.
Example card SQL
-- Bugs created vs. resolved by week, with open bug backlog.
SELECT
  weeks.week,
  COUNT(c.id) AS created,
  COUNT(r.id) AS resolved
FROM (
  SELECT generate_series(
    date_trunc('week', CURRENT_DATE - INTERVAL '12 weeks'),
    date_trunc('week', CURRENT_DATE),
    INTERVAL '1 week'
  ) AS week
) weeks
LEFT JOIN issues c ON date_trunc('week', c.created_at)   = weeks.week
                  AND c.type = 'bug'
LEFT JOIN issues r ON date_trunc('week', r.completed_at) = weeks.week
                  AND r.type = 'bug'
                  AND r.state_type = 'completed'
GROUP BY weeks.week
ORDER BY weeks.week;