





What goes in a DORA metrics dashboard in Metabase?
A DORA metrics dashboard tracks the four keys of software delivery performance — deployment frequency, lead time for changes, change failure rate, and time to restore service — so throughput and stability sit side by side. Build it from CI/CD, version-control, and incident data synced into a database — see GitHub or GitLab for the connection.
For: Eng leaders, platform teams. Refresh: daily. Source: modeled deployments, commits/PRs, and incidents. See DORA metrics for definitions.
What does a DORA dashboard look like?
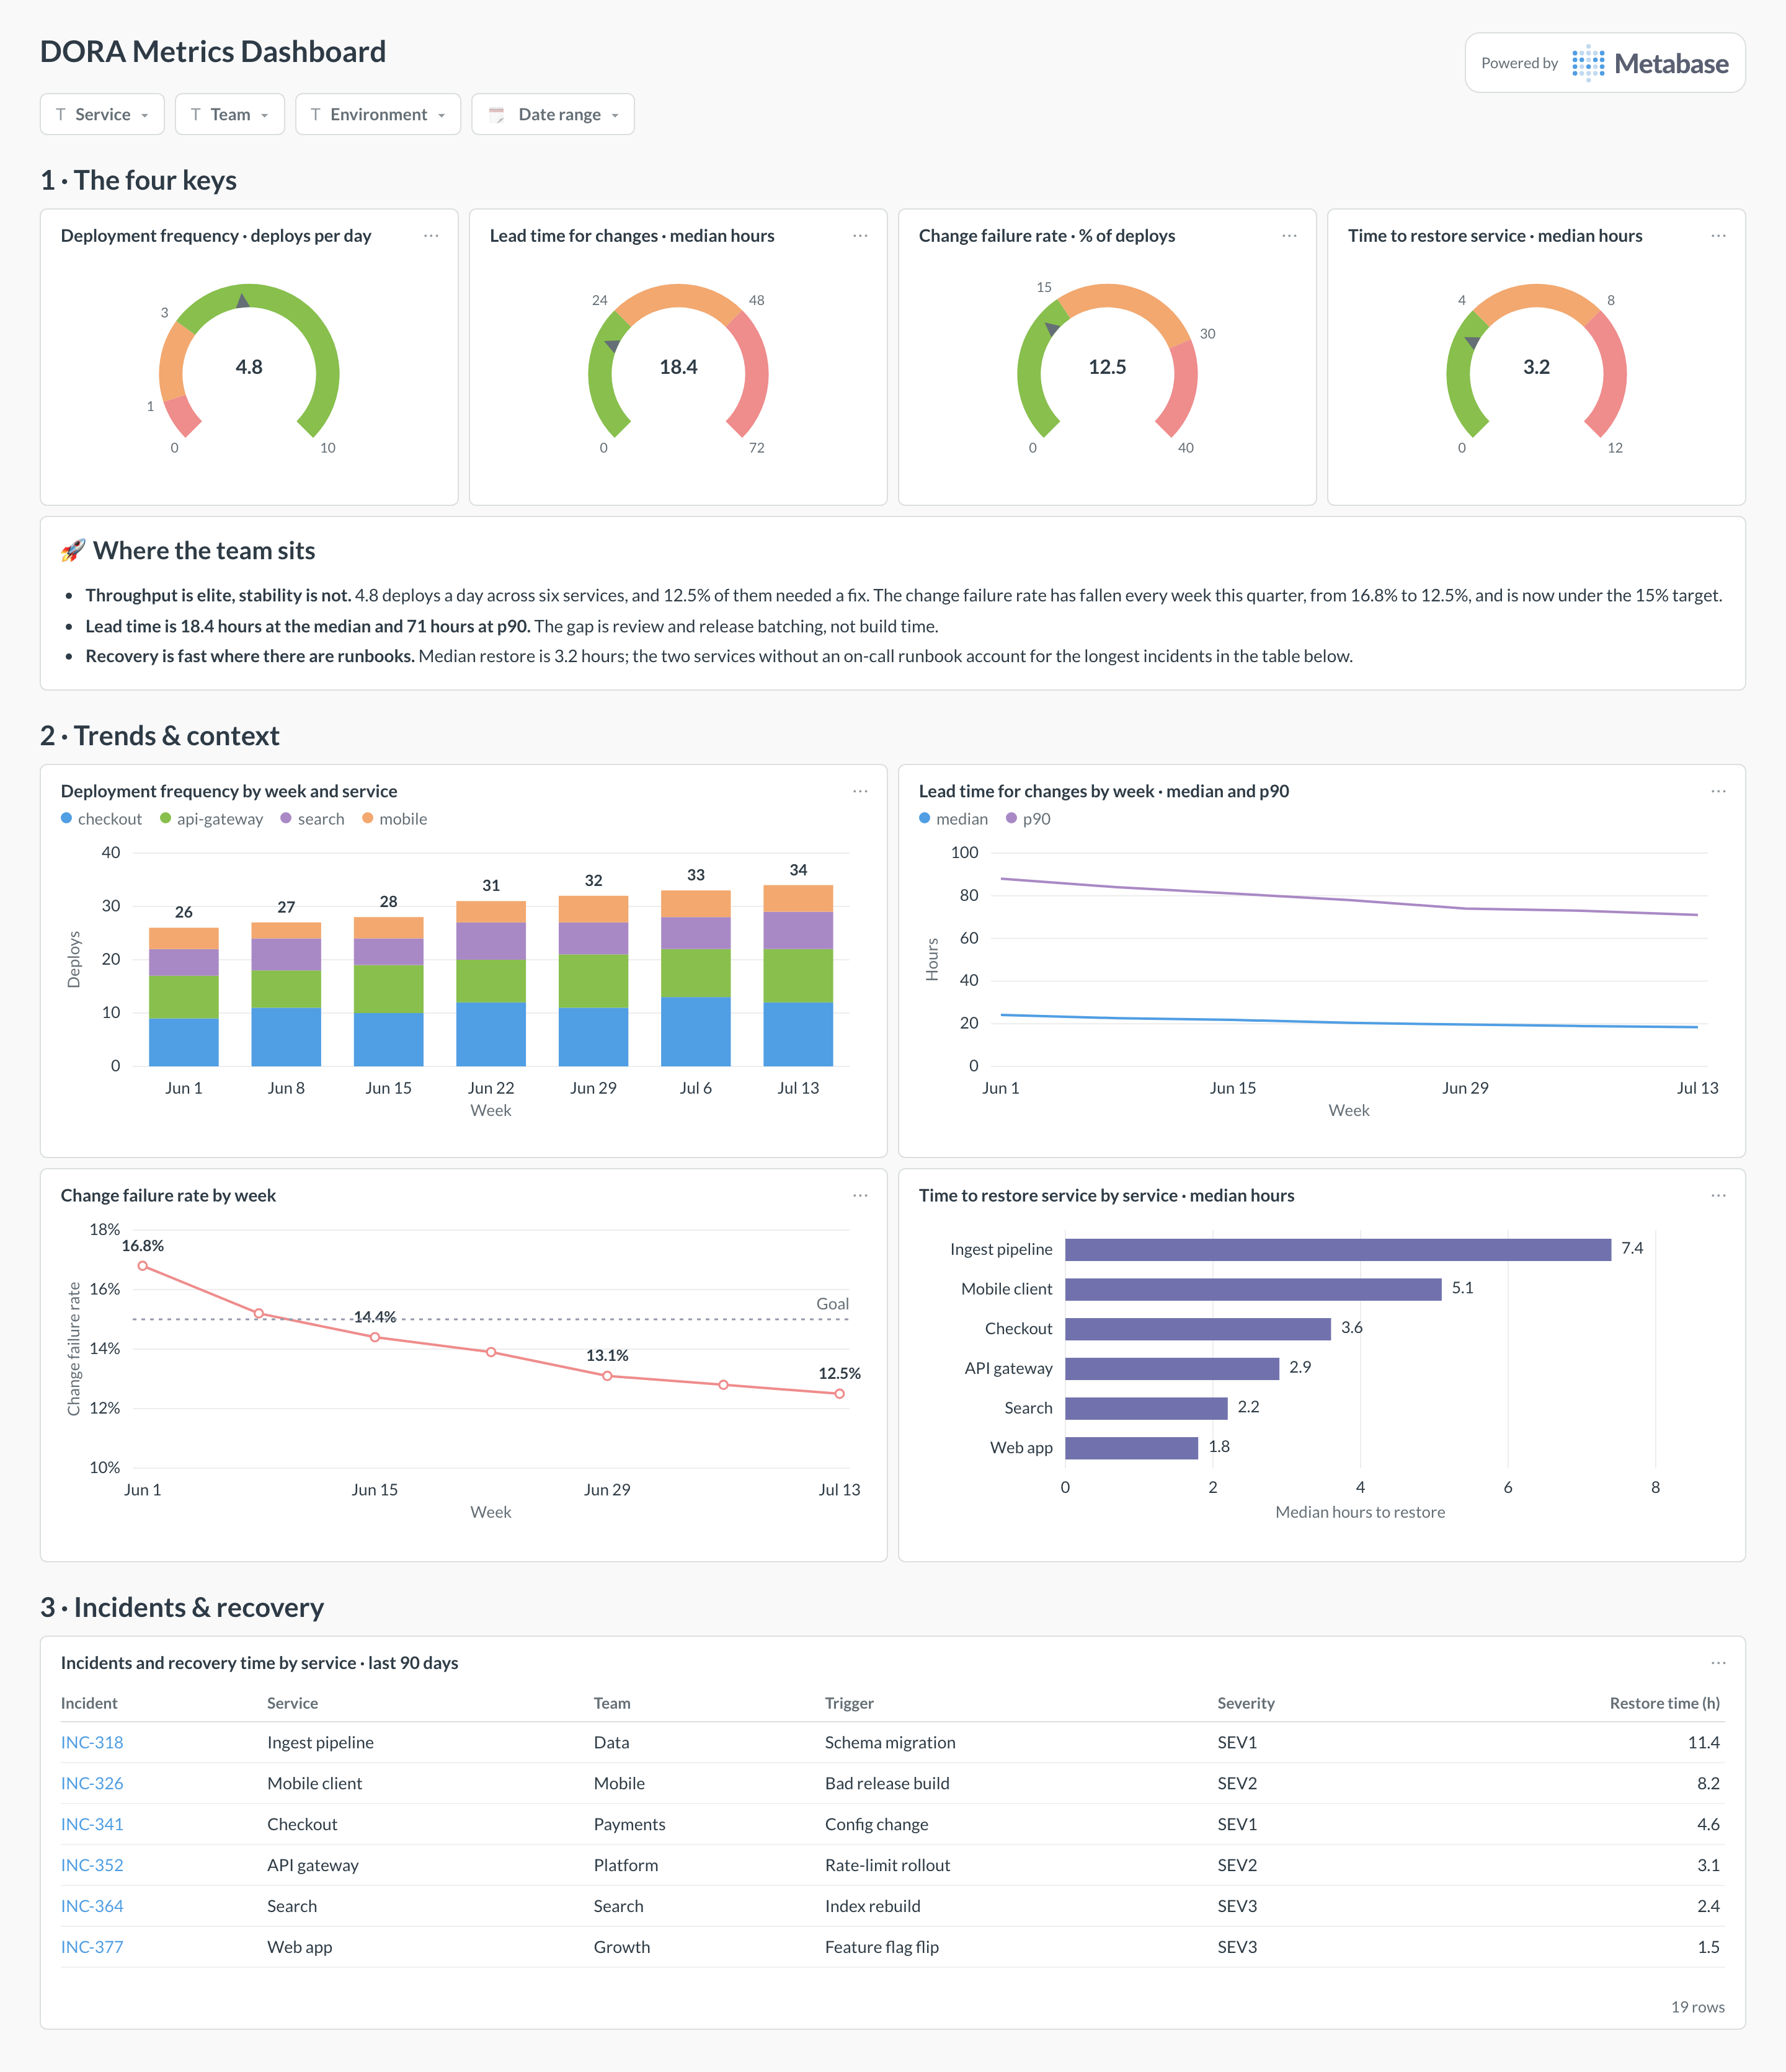
Here’s the layout this guide builds: the four keys as gauges across the top row, then the trend behind each one — deploys by service, lead-time distribution, change failure rate — and finally the incidents that drive time to restore. Read it monthly, and compare the direction of travel rather than the absolute numbers.
Which cards belong on a DORA dashboard?
The four keys (top row)
Trends & context
- Deployment frequency by week and by service
- Lead-time-for-changes distribution (median and p90)
- Change failure rate by week
- Incidents and recovery time by service (table)
What data does a DORA dashboard need?
- A
deploymentstable with timestamp, service, and a failure/rollback flag. - Commit and PR timestamps to compute commit-to-deploy lead time.
- An incidents table with start and resolve times for MTTR.
How do you build a DORA dashboard?
- Sync deploys and version-control data into a database (GitHub or GitLab), plus incidents from your on-call tool.
- Model deployments, changes, and incidents onto a shared schema.
- Compute each of the four keys; show throughput and stability together.
- Add filters for service, team, and date range.
Example card SQL
-- Deployment frequency and change failure rate by week.
SELECT
  date_trunc('week', d.deployed_at)                       AS week,
  COUNT(*)                                                AS deploys,
  COUNT(*) FILTER (WHERE d.caused_failure)                AS failed_deploys,
  ROUND(100.0 * COUNT(*) FILTER (WHERE d.caused_failure)
        / NULLIF(COUNT(*), 0), 1)                         AS change_failure_rate_pct
FROM deployments d
GROUP BY date_trunc('week', d.deployed_at)
ORDER BY week;