





What goes in a subscription analytics dashboard in Metabase?
A subscription analytics dashboard tracks the health of your active base — how many subscriptions you have, what plans they're on, and how trials convert. It's the operational companion to the MRR dashboard. Build it from billing data synced into a database — see Stripe, Chargebee, or Paddle for the connection.
For: Product, growth, RevOps. Refresh: daily.
Source: modeled subscriptions, plans, and trial/conversion events.
What does a subscription analytics dashboard look like?
Here’s the layout this guide builds: the size of the active base at the top, then the plan mix and the movement in and out of it, then how trials are converting. Read it weekly to see whether growth is coming from new subscriptions or from customers moving up a tier.
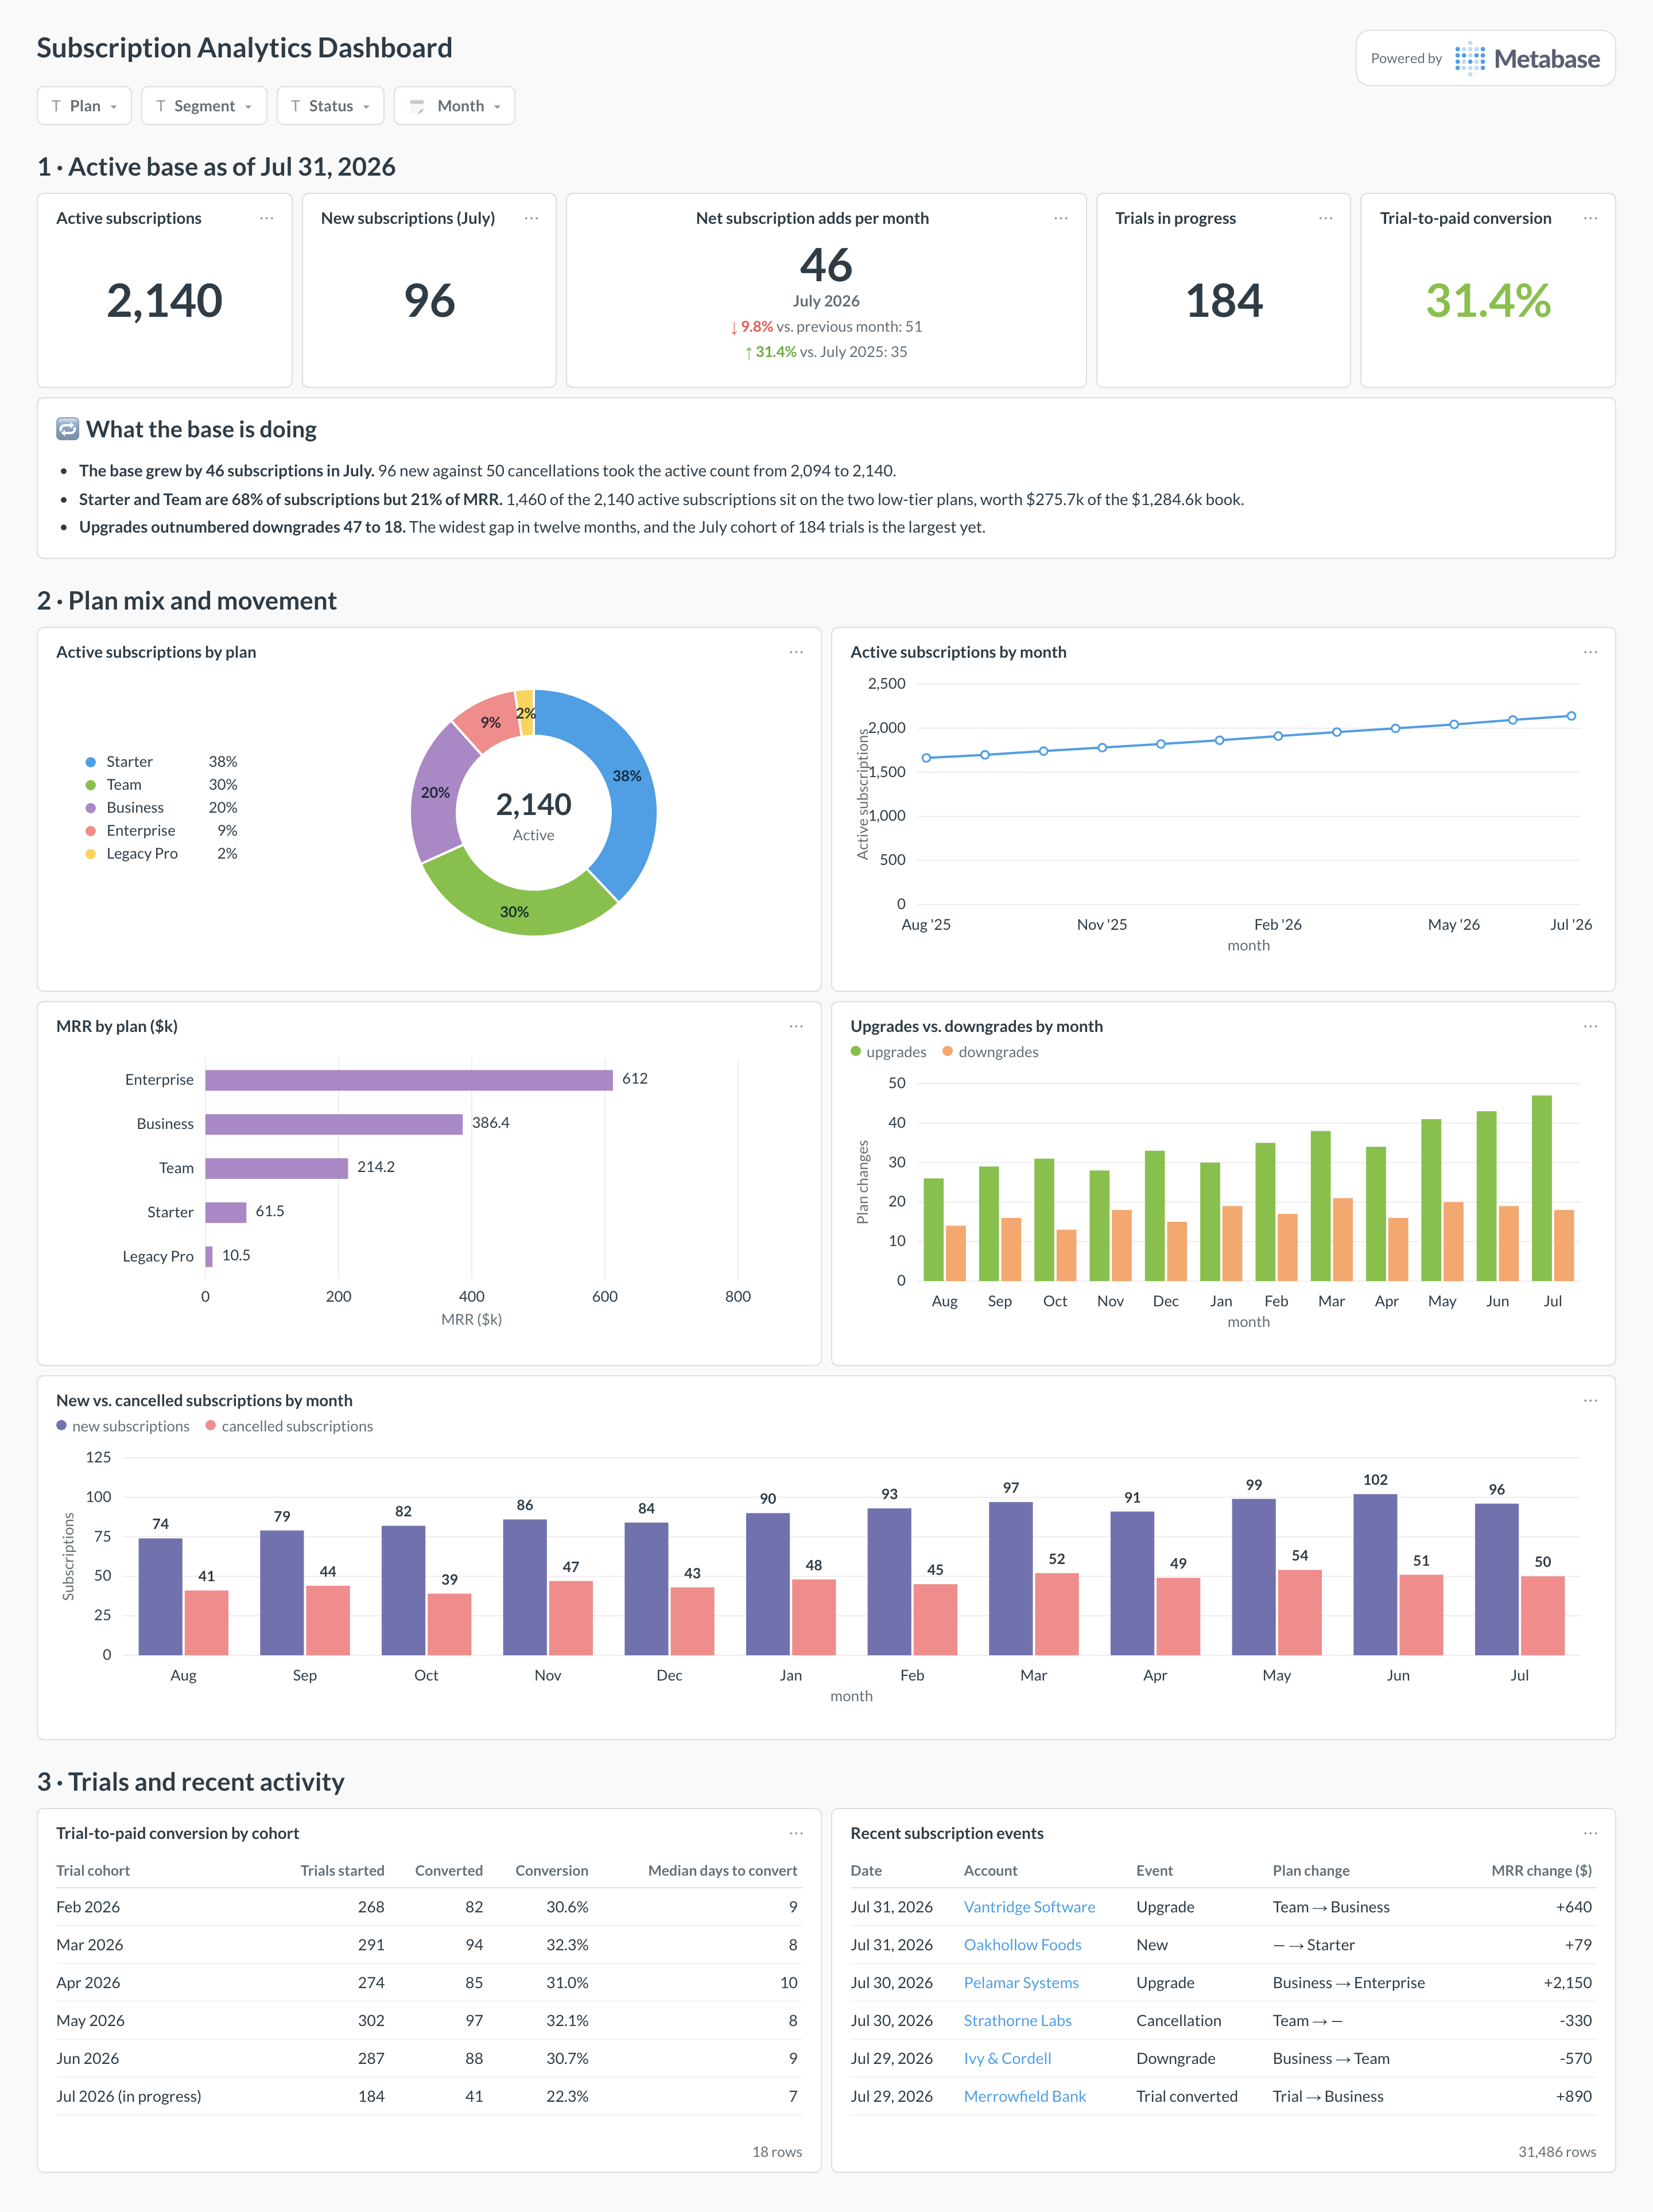
An example subscriptions dashboard in Metabase, built from Stripe, Chargebee, or Paddle billing data. Figures are illustrative.
Which cards belong on a subscriptions dashboard?
Headline KPIs
- Active subscriptions
- New subscriptions this month
- Trials in progress
- Trial-to-paid conversion rate
Mix & movement
- Active subscriptions by plan / tier
- MRR by plan
- Upgrades vs. downgrades by month
- New vs. cancelled subscriptions by month
- Trial conversion by cohort (table)
What data does a subscriptions dashboard need?
- A modeled
subscriptionstable with status, plan, start, and cancellation. - A
planstable with plan names, tiers, and prices. - Trial start and conversion timestamps for the trial funnel.
- Plan-change events to separate upgrades from downgrades.
How do you build a subscriptions dashboard?
- Sync your billing tool into a database (Stripe, Chargebee, or Paddle).
- Model subscriptions and plans; define an active status consistently.
- Derive plan-change direction (upgrade / downgrade) from price at each change.
- Create one card per metric; add filters for plan, segment, and date.
Example card SQL
-- Active subscriptions and MRR by plan, current snapshot.
SELECT
p.name                                     AS plan,
COUNT(*)                                   AS active_subscriptions,
ROUND(SUM(s.mrr), 2)                       AS mrr
FROM subscriptions s
JOIN plans p ON p.id = s.plan_id
WHERE s.status = 'active'
GROUP BY p.name
ORDER BY mrr DESC;-- Trial-to-paid conversion by trial-start month.
WITH trials AS (
SELECT
date_trunc('month', trial_started_at) AS cohort,
id,
converted_at
FROM subscriptions
WHERE trial_started_at IS NOT NULL
)
SELECT
cohort,
COUNT(*) AS trials,
COUNT(converted_at) AS converted,
ROUND(100.0 * COUNT(converted_at)
/ NULLIF(COUNT(*), 0), 1) AS conversion_pct
FROM trials
GROUP BY cohort
ORDER BY cohort;