





What is test pass rate, and how do you measure it in Metabase?
Test pass rate is the share of executed test cases that passed — passing tests divided by executed tests, per suite and per window. It's the test-level counterpart to build success rate: where a pipeline run is simply green or red, the pass rate says how much of the suite failed and which part. Measure it in Metabase from structured test results synced from CircleCI, Buildkite, Jenkins, or GitHub Actions.
passed ÷ executed per suite per week. Skipped tests stay out of the denominator, quarantined tests are excluded from the rate but counted next to it, and the number only means something alongside coverage — a perfect pass rate over a thin suite is a perfect measurement of nothing.What does a test pass rate chart look like in Metabase?
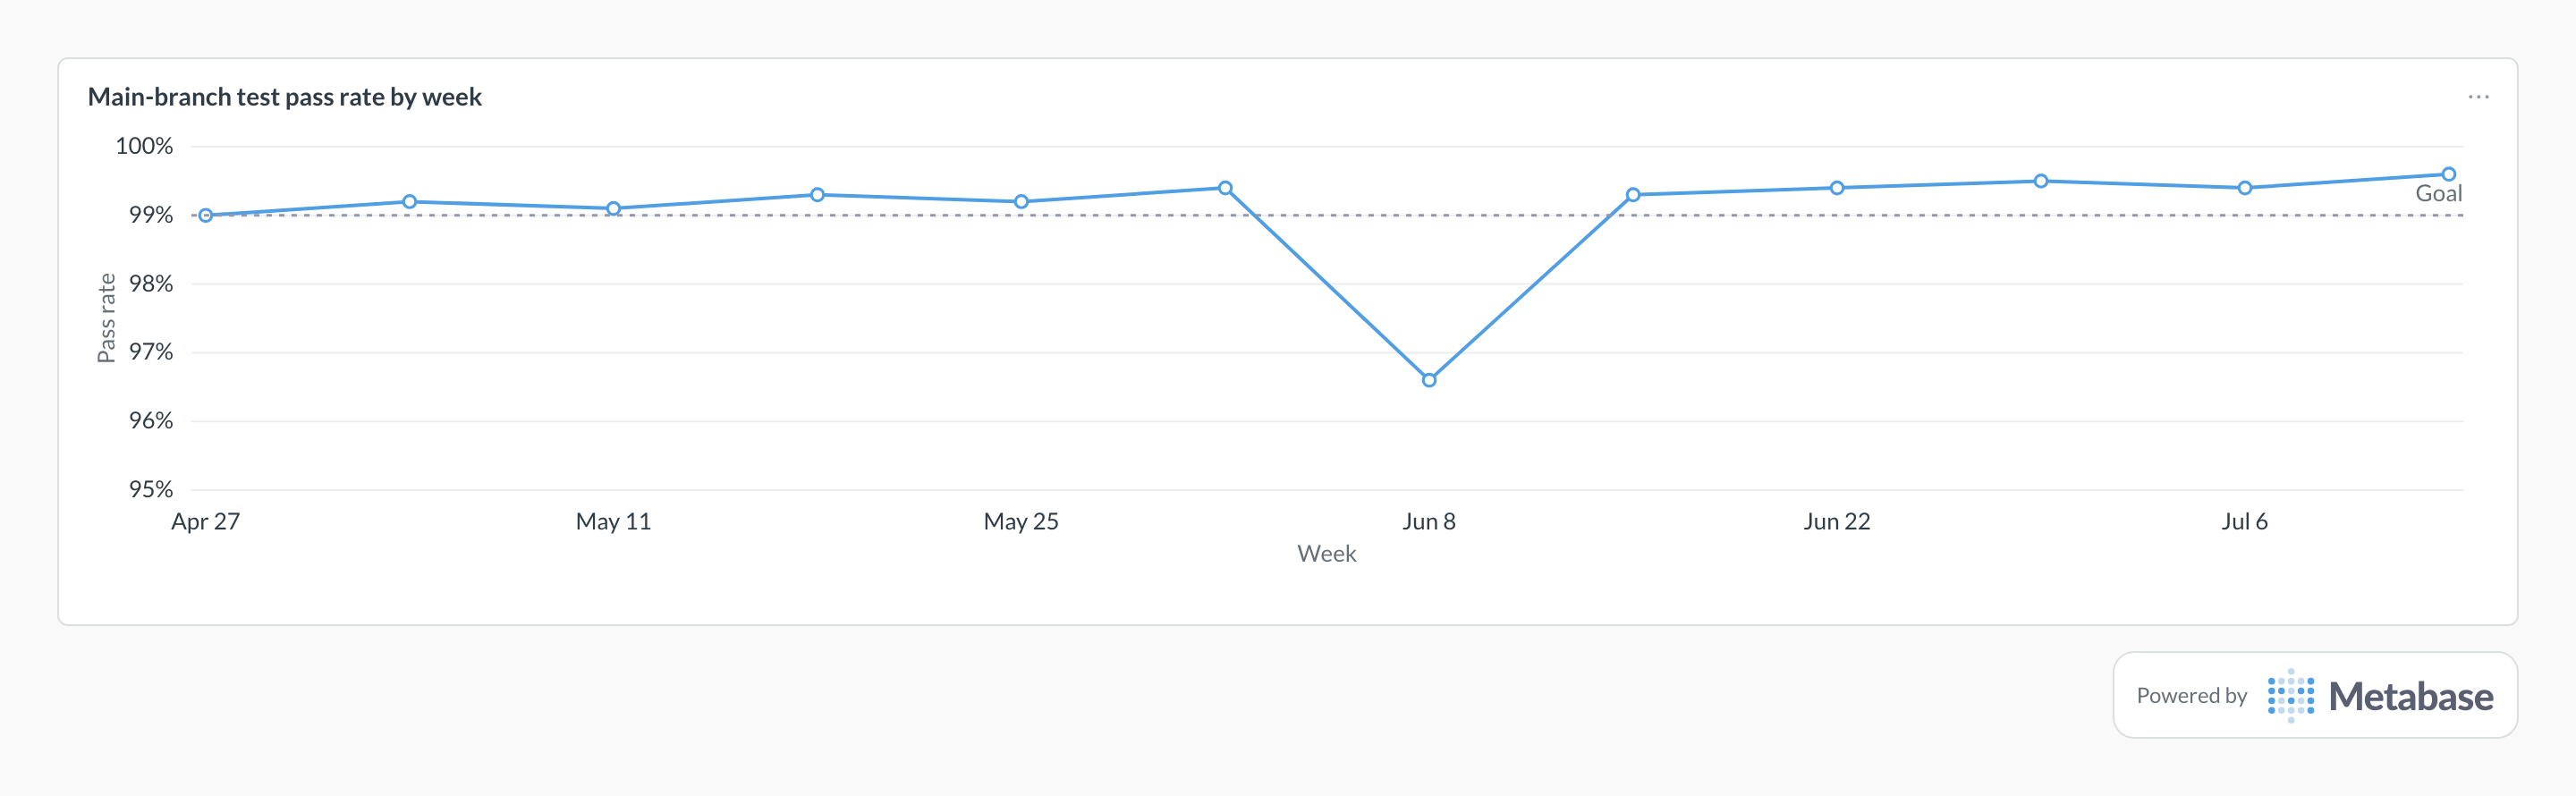
Plot the weekly main-branch pass rate against its goal and expect tenths-of-a-point moves; the interesting signal is any excursion measured in whole points. A dip like Jun 8's almost always means an environment failure took out entire suites — cross-check the flaky test rate before blaming the code.
What does test pass rate measure?
It measures how much of your safety net held on a given run, at case-level resolution. That resolution is the point: one flaky end-to-end test and a broken unit module both turn the pipeline red, but they look completely different in the pass rate.
- By suite — unit, integration, and end-to-end suites have different baselines. Unit suites should sit near 100% on main; end-to-end suites run against real browsers and services and fail for environmental reasons unit tests never see. A blended rate averages a 99.99% unit suite with a 97% e2e suite into a number that describes neither.
- By branch — as with build success rate, main is the headline. PR-branch failures are the suite doing its job.
- Against coverage — the pass rate is conditional on what you test. Track it next to a coverage measure so a green suite over untested code doesn't read as health.
Falling pass rates decompose into two causes with opposite fixes: real regressions (fix the code) and unreliable tests (fix or quarantine the test — tracked separately as flaky test rate). The per-file ranking below is the fastest way to tell which one you have.
What data does it need?
- A
test_resultstable at case grain:test_name,test_file,suite,status,duration_seconds,branch,run_started_at, and a run identifier. - A status taxonomy that separates
passedandfailedfromskipped— only executed tests belong in the denominator. - A
quarantinedflag, so muted tests can be excluded from the rate and counted honestly beside it. - Source: JUnit XML or JSON reports parsed into rows during the CI run, or test metadata pulled from the CircleCI, Buildkite, or GitHub Actions APIs into a warehouse via an ETL job.
SQL patterns
SELECT
  suite,
  date_trunc('week', run_started_at) AS week,
  COUNT(*) AS executed_tests,
  ROUND(
    100.0 * COUNT(*) FILTER (WHERE status = 'passed')
    / NULLIF(COUNT(*), 0), 2
  ) AS pass_rate_pct
FROM test_results
WHERE branch = 'main'
  AND status IN ('passed', 'failed')
  AND NOT quarantined
GROUP BY 1, 2
ORDER BY 1, 2;SELECT
test_file,
COUNT(*) FILTER (WHERE status = 'failed') AS failures,
ROUND(
100.0 * COUNT(*) FILTER (WHERE status = 'passed')
/ NULLIF(COUNT(*), 0), 2
) AS pass_rate_pct,
ROUND(AVG(duration_seconds), 1) AS avg_duration_seconds
FROM test_results
WHERE run_started_at >= CURRENT_DATE - INTERVAL '30 days'
AND status IN ('passed', 'failed')
GROUP BY test_file
HAVING COUNT(*) FILTER (WHERE status = 'failed') > 0
ORDER BY failures DESC, avg_duration_seconds DESC
LIMIT 20;Pitfalls
status IN ('passed', 'failed') and track the skip count as its own number.Where this metric applies
- CircleCI + Metabase — test metadata per job with timing and status
- Buildkite + Metabase — test results per build via Test Engine data
- Jenkins + Metabase — JUnit report data per build
- GitLab CI + Metabase — test report summaries per pipeline
Related
Metrics
Dashboards
FAQ
How is test pass rate different from build success rate?
How does flaky test rate relate to test pass rate?
Should quarantined tests count in the pass rate?
quarantined flag in the model, filter it out of the rate, and put the size of the quarantine list on the same dashboard card.Is a high test pass rate a sign of a healthy codebase?
How do you track test pass rate in Metabase?
test_results table with suite, file, status, duration, and branch. Chart pass rate by suite by week and pin it to a CI pipeline health dashboard next to build success rate.