





What is build success rate, and how do you measure it in Metabase?
Build success rate is the share of completed CI runs that succeeded — successful runs divided by all completed runs, per pipeline and per branch. It's the baseline health check for a delivery pipeline: when it slips, everything downstream — deployment frequency, lead time for changes — slips with it. Measure it in Metabase from run history synced from Jenkins, CircleCI, Buildkite, or GitHub Actions.
successful runs ÷ all completed runs, per pipeline and per branch. Canceled and skipped runs stay out of the denominator, and the main-branch rate — not the blended number — is the headline. What does a build success rate chart look like in Metabase?
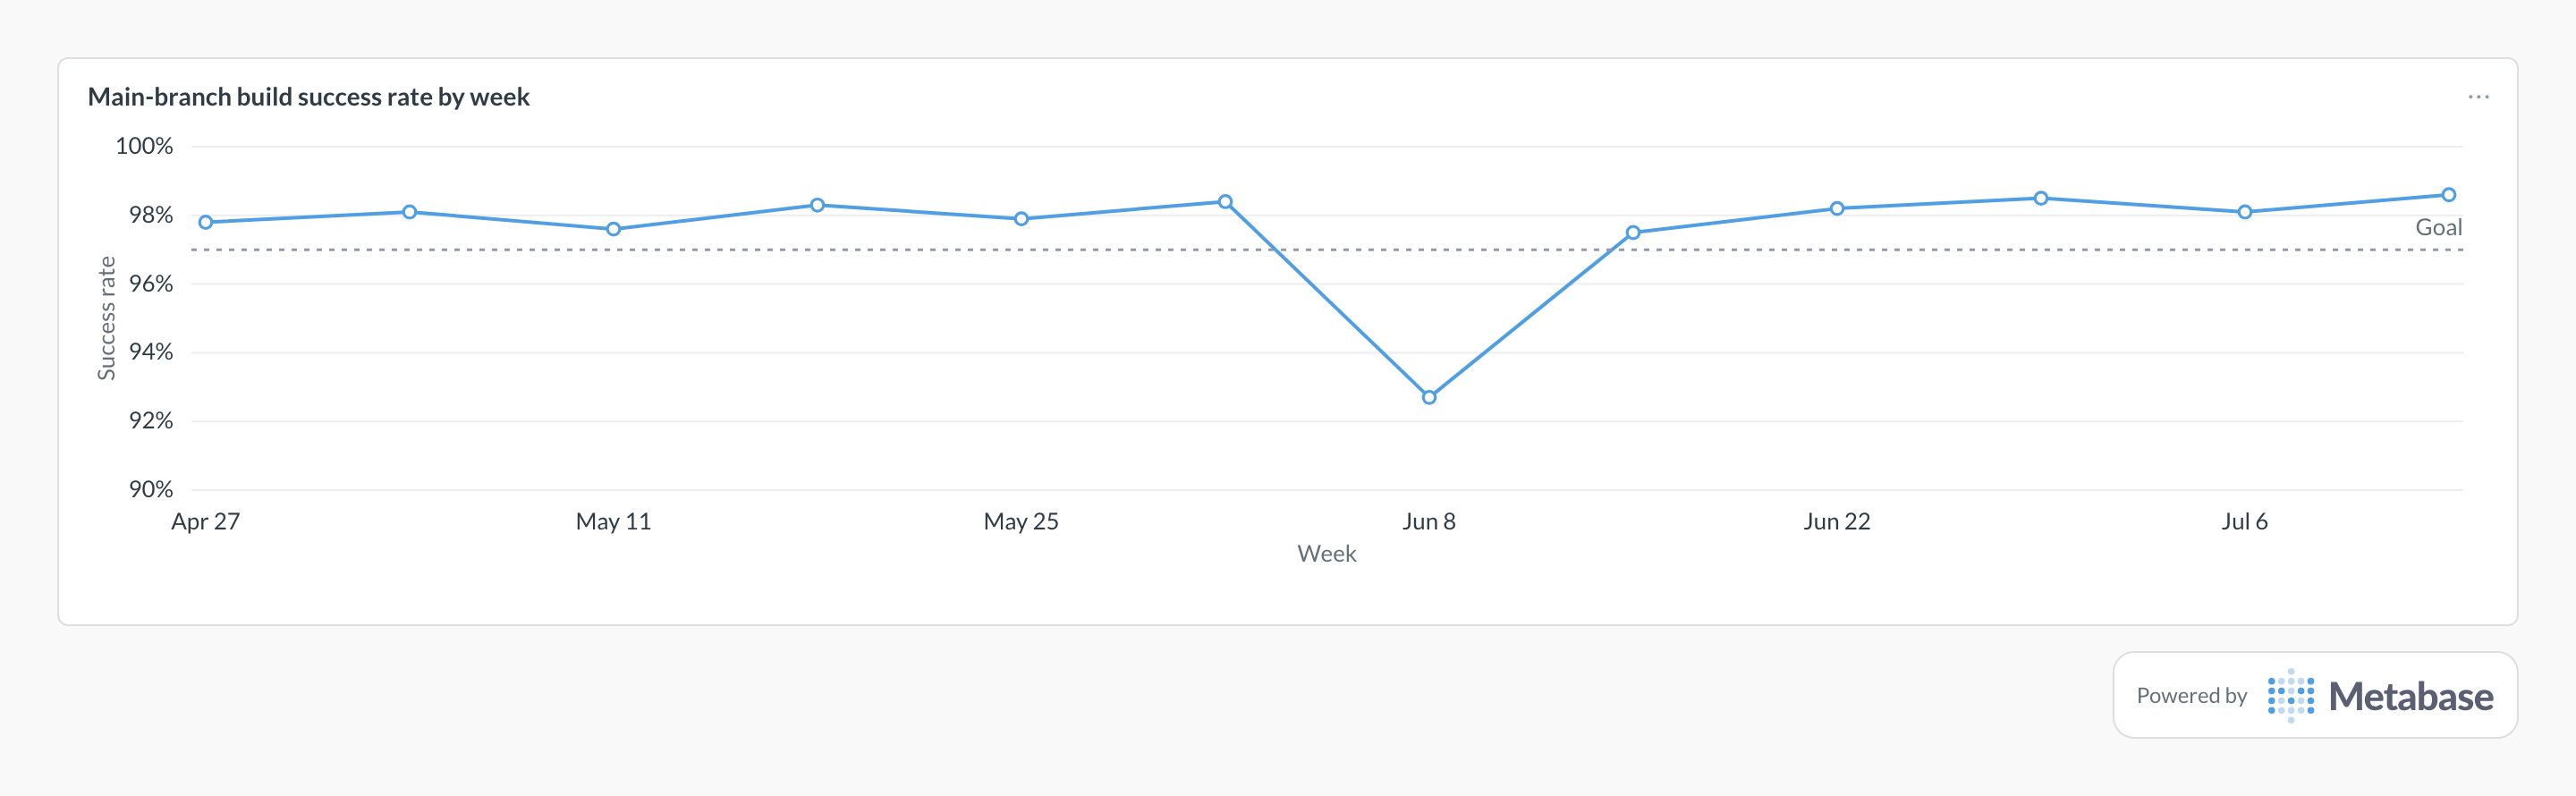
Plot the weekly main-branch success rate as a line against its goal, and expect it to live in a tight band near the top. A dip like Jun 8’s — several points, one week — usually traces to a single broken merge or an infrastructure failure, and what matters is that the line snaps back the following week.
What does build success rate measure?
It measures whether the pipeline is doing its job or getting in the way. Read it in segments, because the blended number hides both stories:
- Main branch — the headline. Main should be green the vast majority of the time; every red run there blocks the whole team and stalls deployment frequency.
- PR branches — failures here are the system working. CI exists to catch broken changes before merge, so a lower PR-branch rate is expected and healthy.
- First attempt vs. after retry — a run that fails and then passes on the same commit succeeded by luck, not by correctness. The gap between first-attempt and after-retry success rates is a direct read on your flaky test rate.
Trend it weekly. Day-to-day the rate is noisy — one broken dependency bump can sink an afternoon — but a weekly trend per pipeline shows whether the suite is getting more or less trustworthy, and it belongs next to the DORA metrics in any software delivery analytics setup.
What data does it need?
- A
pipeline_runstable:pipeline_name,branch,result,started_at,duration_seconds. - A retry link —
retry_of_run_idor a rebuild flag — so first-attempt success can be separated from success-after-retry. - A result taxonomy that distinguishes
failurefromcanceledandskipped; only completed runs belong in the metric.
SQL patterns
SELECT
  date_trunc('week', started_at) AS week,
  COUNT(*) AS completed_runs,
  ROUND(
    100.0 * COUNT(*) FILTER (WHERE result = 'success')
    / NULLIF(COUNT(*), 0), 1
  ) AS success_rate_pct
FROM pipeline_runs
WHERE branch = 'main'
  AND result IN ('success', 'failure')
GROUP BY 1
ORDER BY 1;SELECT
pipeline_name,
COUNT(*) AS completed_runs,
COUNT(*) FILTER (WHERE result = 'failure') AS failures,
ROUND(
100.0 * COUNT(*) FILTER (WHERE result = 'success')
/ NULLIF(COUNT(*), 0), 1
) AS success_rate_pct
FROM pipeline_runs
WHERE started_at >= CURRENT_DATE - INTERVAL '30 days'
AND result IN ('success', 'failure')
GROUP BY pipeline_name
HAVING COUNT(*) >= 10
ORDER BY success_rate_pct;SELECT
date_trunc('week', started_at) AS week,
ROUND(
100.0 * COUNT(*) FILTER (
WHERE result = 'success' AND retry_of_run_id IS NULL
)
/ NULLIF(COUNT(*) FILTER (WHERE retry_of_run_id IS NULL), 0), 1
) AS first_attempt_rate_pct,
ROUND(
100.0 * COUNT(*) FILTER (WHERE result = 'success')
/ NULLIF(COUNT(*), 0), 1
) AS all_attempts_rate_pct
FROM pipeline_runs
WHERE branch = 'main'
AND result IN ('success', 'failure')
GROUP BY 1
ORDER BY 1;Pitfalls
result IN ('success', 'failure')) or the rate swings with push cadence, not code quality. Where this metric applies
- Jenkins + Metabase — build results and retry lineage per job
- CircleCI + Metabase — workflow outcomes by branch and project
- Buildkite + Metabase — build states per pipeline
- Azure DevOps Pipelines + Metabase — run results across pipelines
- GitHub Actions + Metabase — workflow run conclusions per branch
- GitLab CI + Metabase — pipeline statuses by ref
Related
Metrics
Dashboards
FAQ
How do you calculate build success rate?
COUNT(*) FILTER (WHERE result = 'success') / COUNT(*), scoped to result IN ('success', 'failure') so canceled and skipped runs never enter the denominator. Compute it per pipeline and per branch — the main-branch number is the one that belongs on a CI pipeline health dashboard — and trend it weekly rather than staring at a single day's runs.What is a good build success rate?
How is build success rate different from change failure rate?
Do builds that pass after a retry count as successes?
How do you track build success rate in Metabase?
pipeline_runs table with pipeline, branch, result, and retry lineage, and define the rate once as a saved question. Put the main-branch trend and the per-pipeline table on a CI pipeline health dashboard next to pipeline duration.