Understanding customer flow
To estimate how many customers you can expect to acquire, it's useful to think through the stages people go through when interacting with your company.
To forecast customer numbers, think through customer flow
Potential customers start out as prospects: someone or some business who may eventually pay for your product. Prospects may or may not have heard about your company. Taken as a group, your customers and your prospects form your market, that is, the pool of everyone and every business that would possibly be interested in your product.
Prospects can be subdivided based on the different contexts in which they encounter your business, typically:
Marketing funnel
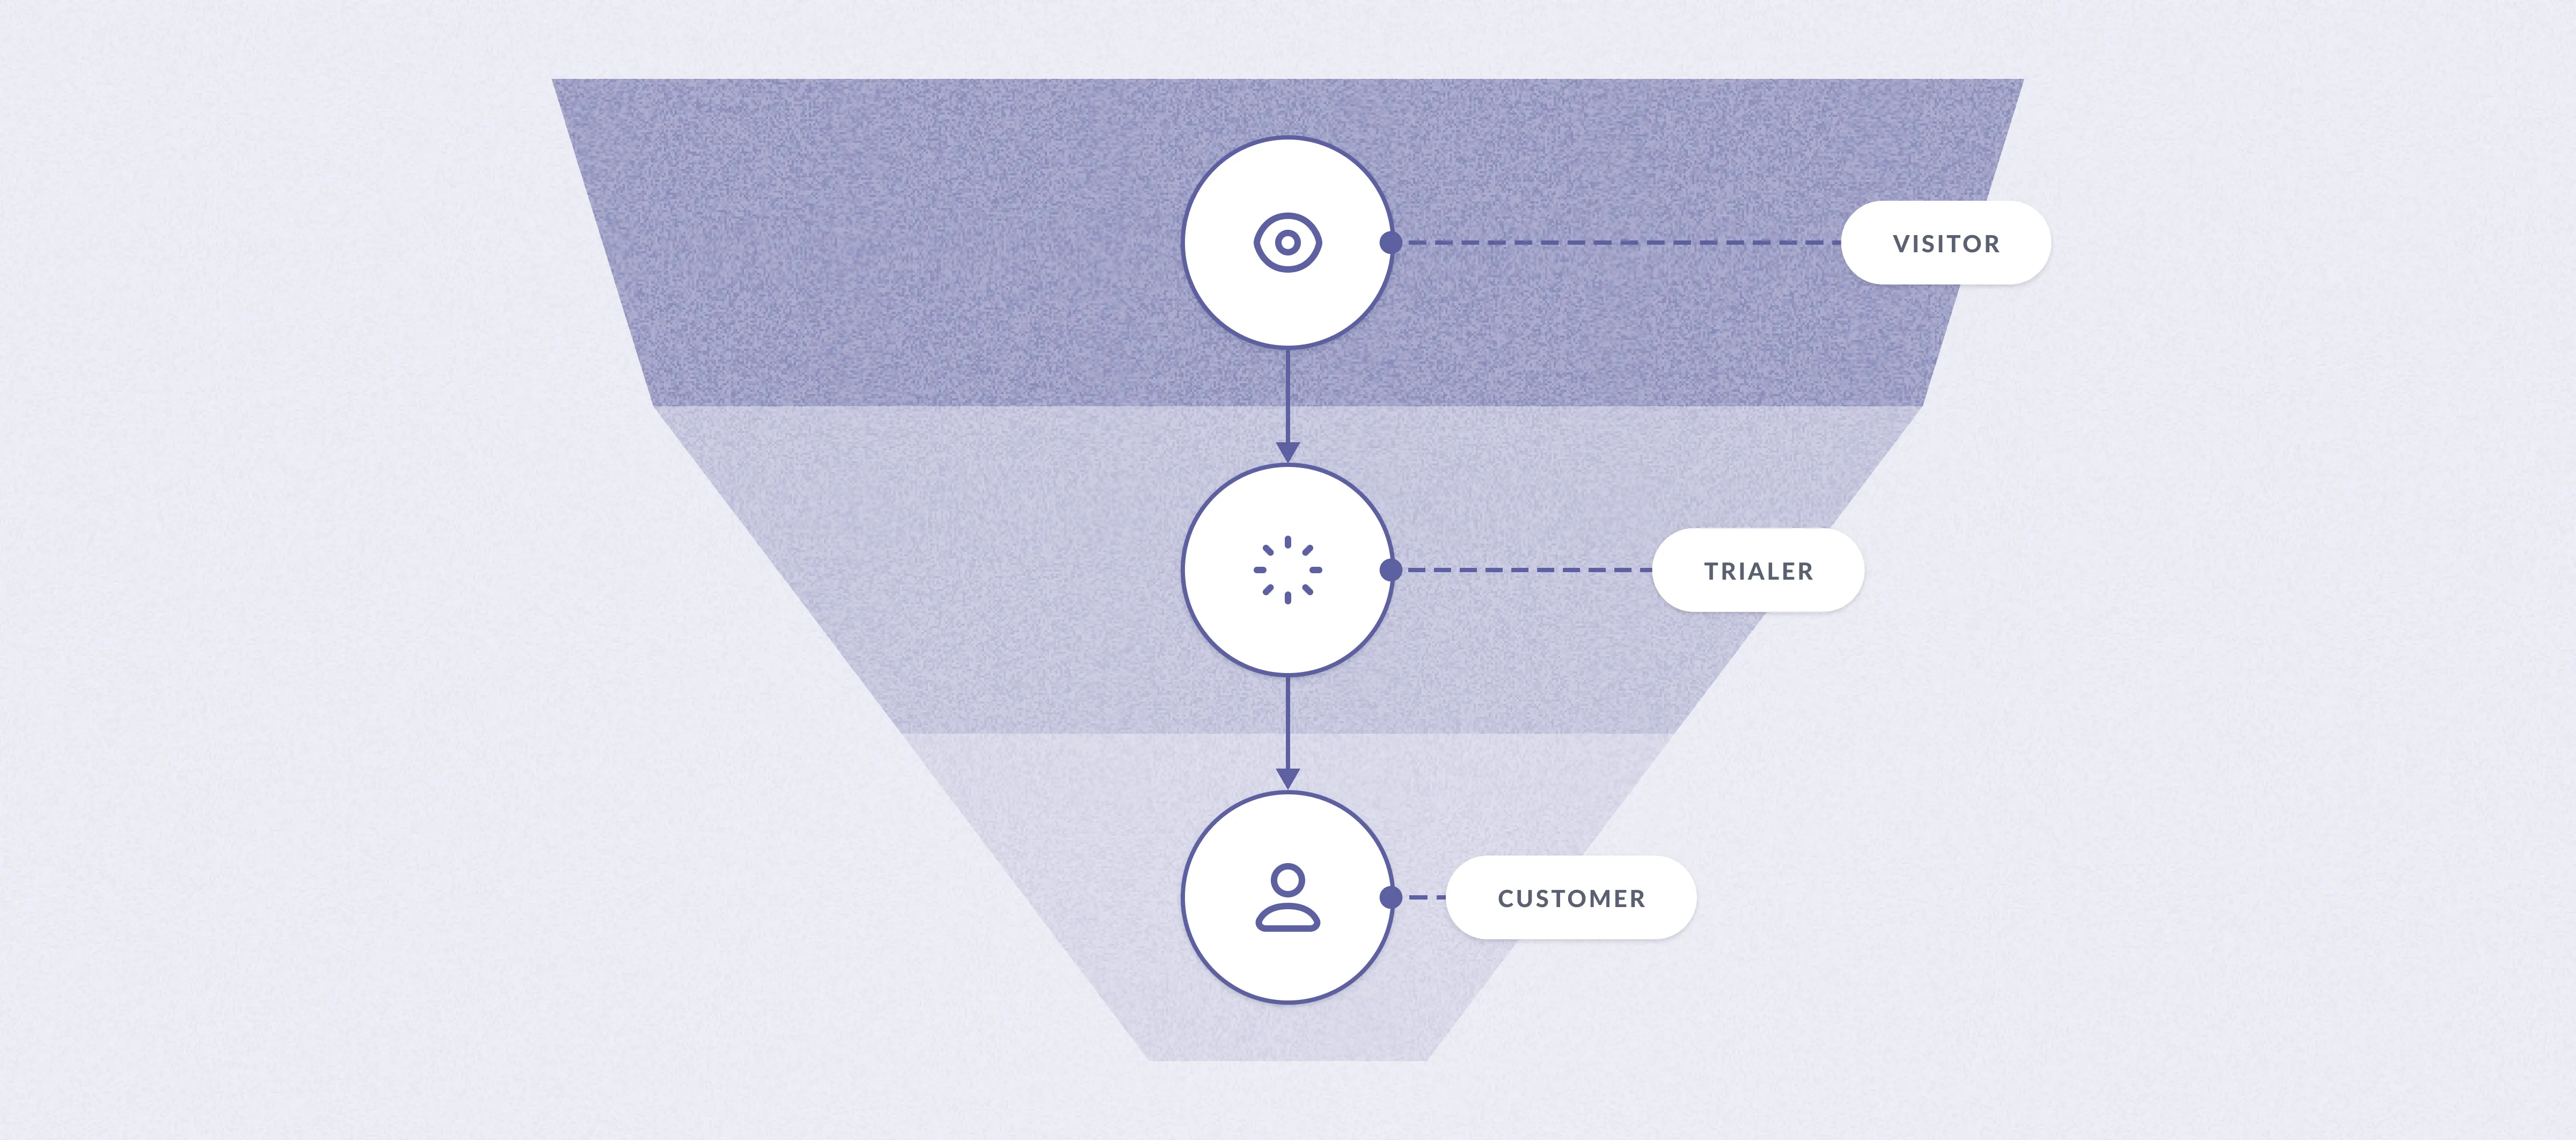
Acquiring customers via your marketing funnel is often called the self-serve route.
- Visitors: Prospects who have shown up to your site.
- Trialers: Prospects who signed up to try out your product, often for free for a week or two. Not all subscription services offer trials, but they’re common. If all goes well, your trialer will convert to a paying customer.
Sales funnel
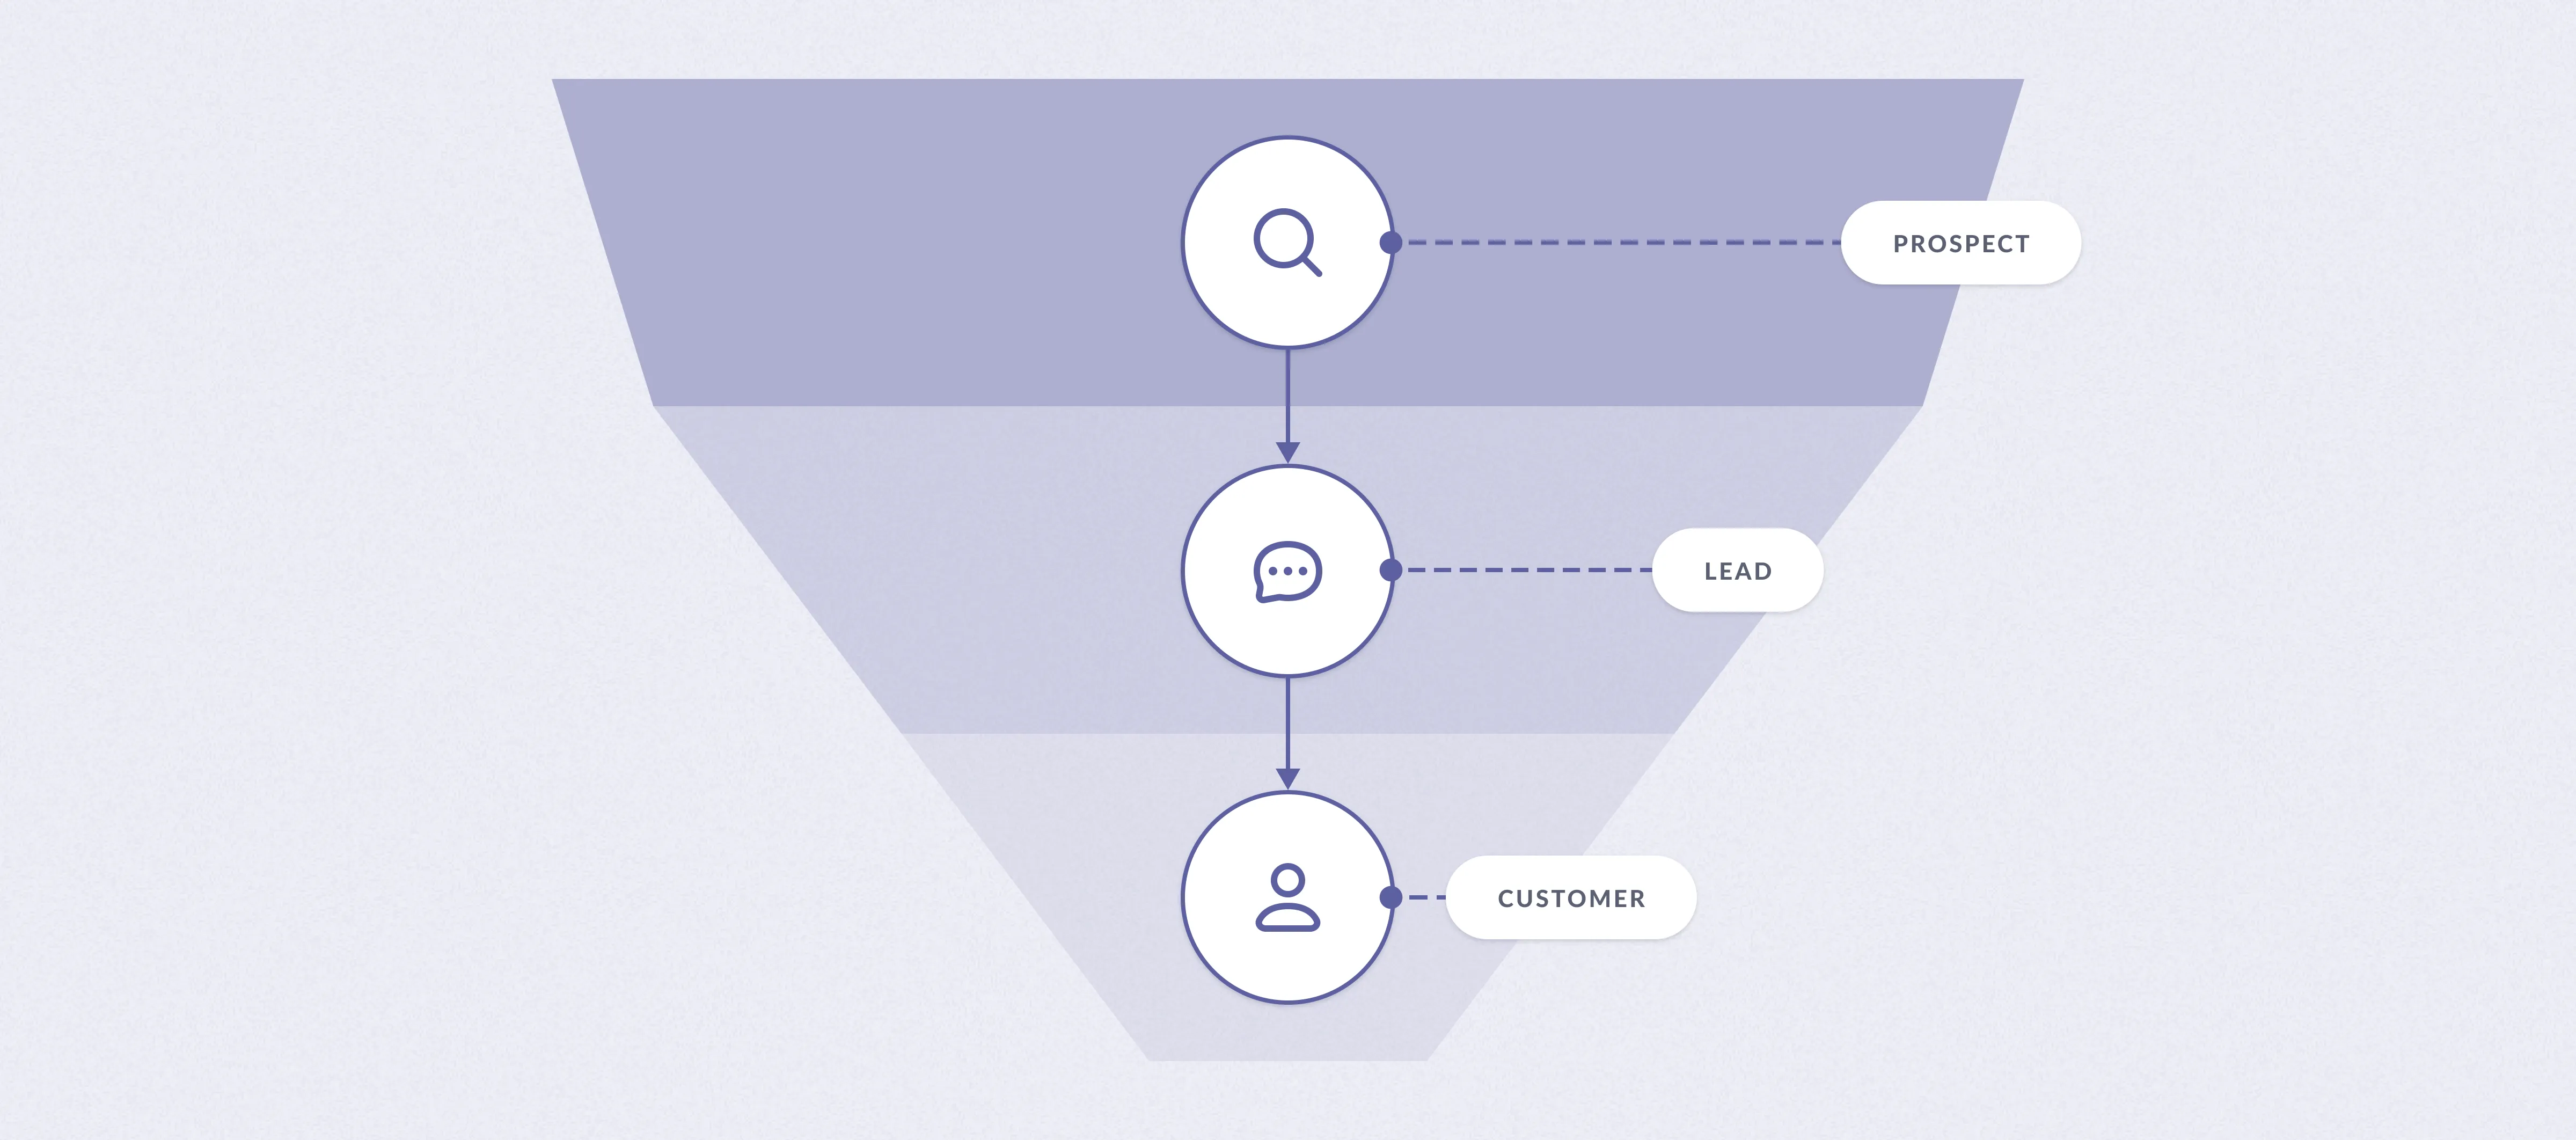
The sales funnel is typically more hands-on.
- Leads: A person or company your sales team is interested in selling to. From a practical point of view, a lead is just someone whose contact details you have and who you think you might be interested in your product. For example, a lead could be someone who has filled out a contact sales form on your website.
- A deal starts once your sales team engages with a lead. The deal itself is not a prospect, but you usually have one prospect involved in each deal. During the deal, a sales representative will usually go through stages of demoing your product. If all goes well, your deal is won (or ‘closed-won’), and the lead converts to a new customer.
Keep in mind that marketing and sales funnels aren’t strictly separate. For example, people can visit your website, then fill in a “Speak to sales” form, which would make them a lead.
Labeling customers
Once someone clears your sales or marketing funnels, they start giving you money, which is great. At that point it becomes useful to label your customers, which in subscription-based companies are also called subscribers.
- New customers: A customer is usually considered new during the first month they subscribe to your product.
- Logos and accounts are also used to refer to customers, typically if your customers are businesses. These terms can be useful to distinguish the company (a “logo”) that has multiple individual people at the company that you either interact with, or who sign up for different products (e.g., their ops team has one subscription, their Denver office has another, or whatever).
- Churned customers: Customers who end their subscriptions.
Forecasting new customers
You forecast new customers by looking at your sales and marketing funnels. You usually start at the top of the funnel and then multiply the numbers by conversion rates for each successive stage. Conversion rates themselves can be forecast based on historical averages.
Example:
| Metric | Month 1 | |
|---|---|---|
| Number of website visits | 10,000 | ← based on historical averages |
| Conversion rate | 1% | ← based on historical averages |
| Number of trials | 100 | |
| Conversion rate | 30% | ← based on historical averages |
| New customers | 30 |
Tracking customer churn and retention
You’re going to lose customers. But how many?
There are two ways of looking at this: churn rate and retention rate.
Customer churn rate (CCR), also known as logo churn rate. The focus is on rate, not count, because losing 10 customers per month when you have 10,000 customers is a much different scenario than if you lose 10 customers when you only have 100 customers. To account of relative sizes, companies track their customer churn rate, expressed as a percentage, and calculated as:
Customer churn rate = Number of churned customers in a month / Number of customers at the start of the month
Example: So if you started with 500 customers, and 12 customers churned that month, your churn rate would be:
12 / 500 = 0.024
So 2.4%.
Customer retention rate, also known as logo retention rate, is the opposite of the customer churn rate. How many of the customers you had at the start of the month that are still around at the end of the month. Expressed as a % and calculated as:
Customer retention rate = Number of customers who started and ended the month / number of customers at the start of the month.
So if you had 500 customers at the start of the month, and 488 customers at the end of the month:
488 / 500 = 0.976
or 97.6%
Forecasting the number of churned customers
You forecast churned customers by multiplying the customer churn rate by the starting number of customers each period. The customer churn rate can be forecast based on historical averages.
Example:
| Month 1 | ||
|---|---|---|
| Customer beginning balance | 100 | |
| Customer churn rate | 2% | ← based on historical averages |
| Churned customers | 2 |
Forecasting your total number of customers
You can forecast your total number of customers each month by tracking the formula below, and ‘walking it forward’ for future months.
Ending customers (the customer ‘ending balance’) = Starting customers (the customer ‘beginning balance’) + new customers - churned customers
Example:
| Month 1 | Month 2 | Month 3 | |
|---|---|---|---|
| Customer beginning balance | 0 | 10 | 22 |
| New customers | +10 | +15 | +13 |
| Churned customers | 0 | -3 | -5 |
| Customer ending balance | 10 | 22 | 30 |