Financial modeling template
A tour of the financial modeling template's sheets and sections.

We built a package that you can use to populate our Financial model template with your own data (assuming you use a particular set of tools).
While the package and its template are prescriptive, there’s no need to overindex on the exact setup. Even if you can’t use the dap package, you can still poke around the spreadsheet template and get some inspiration, or even adapt the sheet to your own needs.
This page walks through the different sections of the Financial modeling template.
Tracking historical metrics, projecting them into the future, and modeling alternative scenarios
The spreadsheet will have three visible sheets, and three hidden sheets that will contain data that you import from the metrics store that the package sets up in Metabase.
Visible sheets
Hidden sheets
These sheets pull data from your metrics store in Metabase and make them available for the formulas on the main, visible sheets.
- _imported_latest_metrics
- _imported_quarterly_metrics
- _pivoted_quarterly_metrics
For more on hidden sheets, see Google’s documentation: Protect, hide, and edit sheets.
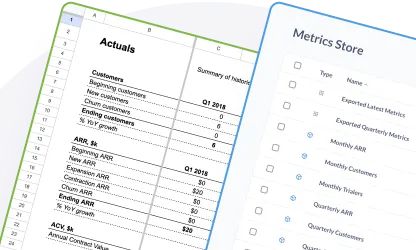
Actuals sheet
For your financial model, you’ll want to track several different outputs that help people understand how your startup has performed historically.
You’ll organize this sheet into sections that group related metrics:
- Customers
- Annual recurring revenue (ARR)
- Annual Contract Value (ACV)
- Customer Acquisition Cost (CAC)
Customers
For each period, you’ll track:
- Beginning customers: the number of customer you have at the start of the period.
- New customers: prospects that converted to paying customers.
- Churn customers: the number of people who cancelled their subscriptions during that period.
- Ending customers: the total number of customers at the end of the period.
If your startup has survived for more than a year, you’ll also calculate the year-over-year (YoY) growth in the number of ending customers.
Annual recurring revenue (ARR)
- Beginning ARR: Your total ARR coming into the period.
- New ARR: How much ARR we added to the total ARR during that period from new customers.
- Expansion ARR: How much more money that existing customers paid you (via added accounts, upgrades, etc).
- Contraction ARR: The total reduction in the amount that existing customers paid you.
- Churn ARR: The total loss in ARR due to customers cancelling their subscriptions.
Annual contract value (ACV)
Here you’ll keep your ACV, which refers to the average contract value for one customer for a year.
Customer acquisition cost (CAC)
Here you’ll list how much it costs to acquire a customer, and how long it takes a customer to pay back those acquisition costs.
- Total S&M spend: Total spent on sales and marketing (S&M).
- CAC Payback (mo): How many months it takes to pay back the cost to acquire a customer.
Income statement
Here you’ll snapshot all the money coming in and going out.
- Revenue: The money coming in.
- Non-payroll expenses: Infrastructure costs and other expenses (anything that isn’t payroll).
- Payroll expenses: Paying people to run your business.
- Operating income: Revenue minus both payroll and non-payroll expenses.
Churn stats
Here you’ll list:
- Quarterly churn rate: The percentage of customers who cancelled their subscription in the quarter.
- Annualized churn rate: The same as above, only annualized.
See Churn rates.
Projections sheet
The Projections sheet extends those actuals into the future. This sheet includes the historical data to give a sense of progression so people don’t have to flip between sheets to see what your numbers have been like in the recent past.
The sheet is divided into two sections, Yearly and Quarterly.
Most of the projections sheet’s magic is driven by the Inputs sheets, so we should just skip to that.
See also Projections
Inputs sheet
The Inputs sheet is the fun sheet. It’s organized into three sections:
Exported CSV URLS
In order for the template to work at all, you’ll need to expose data from your Metabase for the template to import. You can do this by sharing the results from a question via a CSV using a public link.
You’ll take the URLs that dap create outputs (the ones that expose your metrics as CSV downloads) and paste those into the input cells in rows 3 (Quarterly Metrics) and 4 (Latest Metrics).
Once you paste those URLs, your sheet will import that data (via the hidden sheets mentioned above) and populate the sheets with your data and its calculations.
Depending on how much data you have in your metrics store, the import task might time out on the first try. But if you’ve enabled model caching in your Metabase, Metabase will cache the results of the initial run, which will greatly reduce the time it takes to return results. So you may need to wait a few minutes for Metabase to run the queries it needs to run and cache those results before trying to re-paste those URLs into the spreadsheet.
For more on how to set this up, check out Metabase as a metric store.
Actuals
The actuals section repeats some data from the Actuals sheet for your reference. The Actuals section within the Inputs sheet also contains additional growth, conversion, and churn rate data from the hidden pivoted quarterly metrics sheet, as well as fields for costs and expenses that you’ll need to input manually.
Forecasting
This is where things get interesting.
The Forecasting section includes some fields and knobs for you to tweak to explore alternative scenarios. You can use this section to plug in values for your driver times series to see what would happen if you were to increase or decrease the value of a particular metric (one of your business’s “levers”).
The Forecasting section features three subsections:
Model inputs
The Model inputs section allows you specify whether you’d like to view the outputs as either:
- Linear (constant growth)
- Exponential (compound growth)
For both Linear and Exponential models, the default growth rate used is the latest growth rate (highlighted in the orange box).
You can change whether each of the driver times series increases at a linear or exponential rate, and view the results in the Projections sheet.
Customizable inputs
If you want to manually specify target rates per quarter, you can plug in what you expect (or hope) the rate will be for each quarter.
For example, let’s say you want to focus on converting trialers to customers, and your current trialer conversion rate is 20%. What would your ARR look like if you were to improve your conversion rate by 10% over the next two quarters? You can plug in 25% and 30% for your expected conversion rate in the upcoming quarters to see how that improvement would affect your ARR in the Projections sheet.
Fixed predictions
These are the driver time series we’ve selected. These are the values you have some control over. They are some of the “levers” of your business that you can adjust. This template suggests the following driver time series:
- # Trialers
- ACV
- # Headcount
- Avg Salary
- S&M Spend (payroll)
- S&M Spend (nonpayroll)
These fixed predictions will change based on the model type you select (linear or exponential), or based on the values you input in the Customizable inputs section.