


“Can you give me data for X?” - a question Data Scientists might receive quite often - as so did our team.
Even though, in most of the cases, the data people are asking for is not what people actually need, it was a sign that something was odd.
Why we introduced OKRs for our data analytics team
We realized that one of the reasons we received those questions was that we failed to implement the basis for self-service analytics. We needed to face the truth and acknowledge the problems at hand:
- We did a bad job at educating people on how to use and analyze data;
- Combining data for analysis was not possible for non-engineers or people without database and SQL knowledge because of bad integrations between different data sources;
- Data Science became the bottleneck for data driven decisions and were even preventing them when we were too slow;
We needed a better strategy to make data more accessible—and we needed a framework to align the team and track progress. That’s when we turned to OKRs (Objectives and Key Results).
What are OKRs and why are they useful for analytics teams?
A strategy shift towards more data accessibility and enabling self-serving analytics needed to happen and we needed a framework to properly align the team and be able to measure our progress. During that time our company started looking into OKRs (objectives and key results). OKRs are a goal-setting methodology for teams that helps you to set measurable goals. The key idea is that you define ambitious goals which can be measured by 3-5 key results each where the following template can be used:
I will [objective] measured by [key result].
Our Data Science team wanted to become pioneers and give the framework a try.
Our first OKR: make data accessible across the company
- We wanted to define goals together as a team in order to increase alignment and goal ownership;
- We wanted to be able to measure our progress in a transparent way;
- Our daily work should be closely connected to the goals we want to achieve;
We set together and analyzed the current situation to derive objectives and key results. Our goal was to lay the foundation for bigger steps in the future and start off setting up a data warehouse structure with pre-joined and processed tables which are easy to analyze for our business users. Thus, an example objective we set ourselves was “Data is accessible to everyone in the company”.
Tracking OKR Progress in Metabase
To keep our goals visible and actionable, we created a dashboard in Metabase to track OKR progress. Each week, we reviewed the dashboard together during OKR check-ins.
This included the following key results we used to measure our success:
- All new Metabase questions use the centralized data warehouse
- Questions in Metabase follow a consistent folder structure
- Every table in the warehouse layer has a description
- Every column used by business users has a description
Those sound like pretty basic key results at first sight. However, they turned out to play a key role in measuring basic accessibility.
We created a dashboard in Metabase to measure our progress and look at the data during our weekly OKR progress check-ins:
The steps we took to set up the OKR dashboard in Metabase
Disclaimer: The following steps are tailored for a warehouse setup with BigQuery and a Metabase instance running with a Postgres database
- Connect Metabase with your BigQuery project (docs)
- Connect Metabase to the Postgres database where your Metabase data is stored (docs on how to connect to a Postgres DB)
- Create the questions you want to see in your dashboard (compare to the template queries below)
- Combine all newly created questions in a dashboard.
Query Templates
Here are some query templates that can get you started in case you want to build something similar. To make it work for you, you might want to replace some variables in the following queries:
<YOUR_DATA_REGION>: The region where your data is stored e.g. region-europe-west1
<YOUR_GOOGLE_PROJECT_NAME>: Your google cloud project name
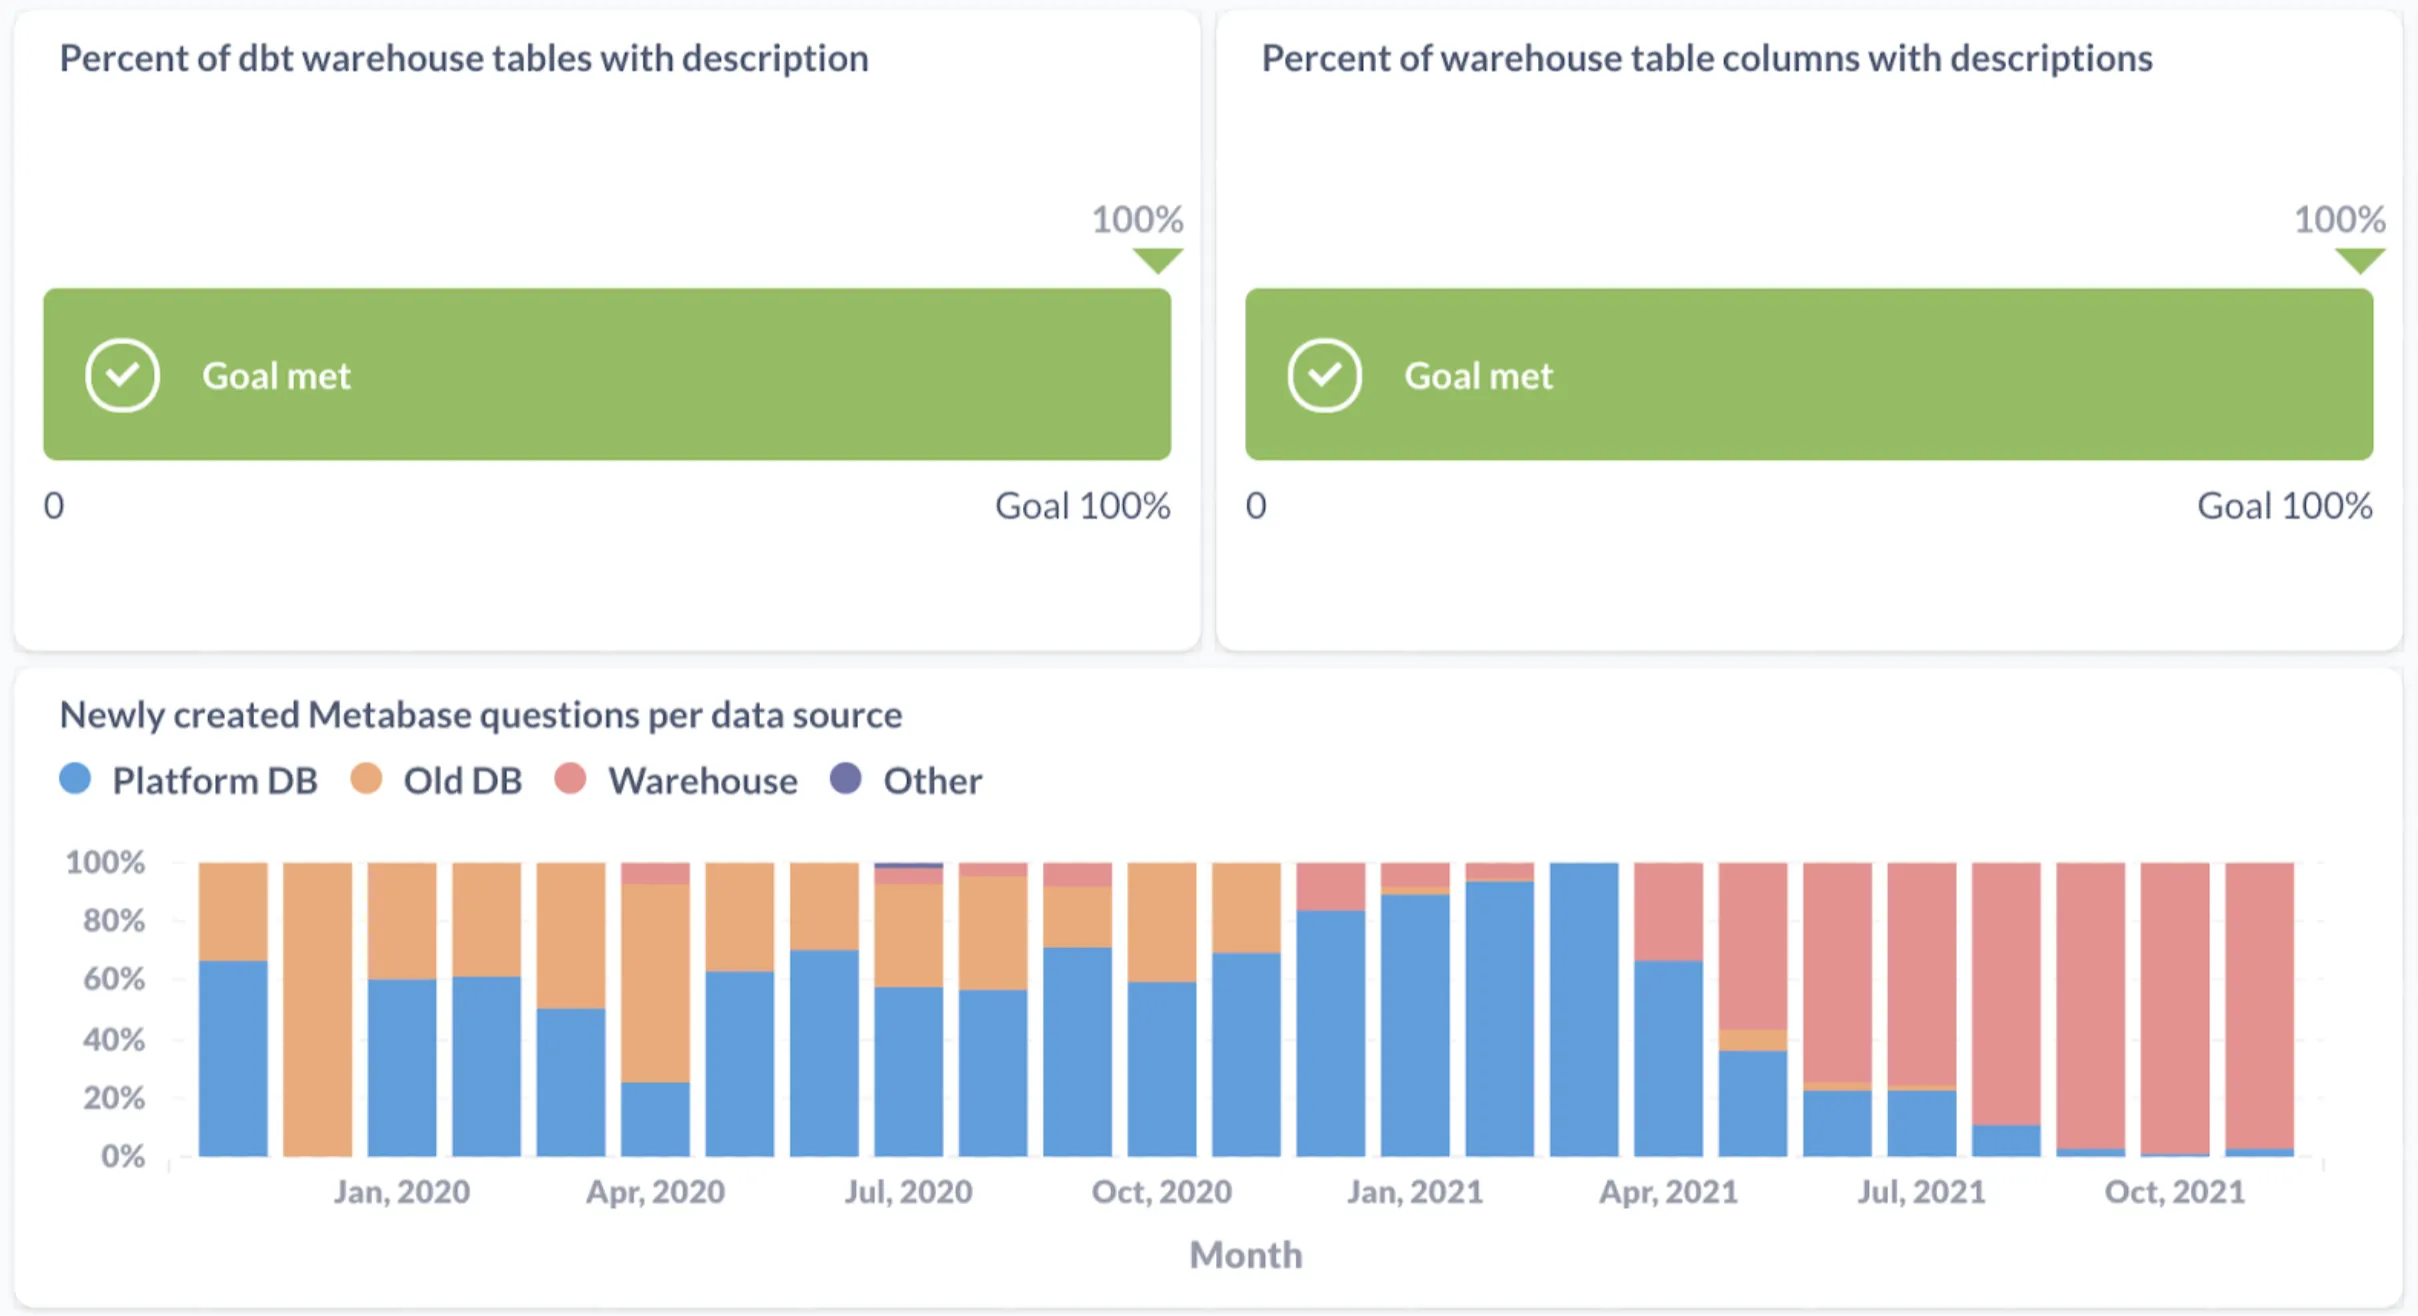
Percent of dbt warehouse tables with description
Shows the progress of warehouse tables and views created with dbt which have a description.
We used this SQL query for that:
WITH descriptions AS (
  SELECT
    table_name,
    1 AS has_description,
  FROM `<YOUR_DATA_REGION>.INFORMATION_SCHEMA.TABLE_OPTIONS`
  WHERE
    option_name = 'description'
    AND option_value <> '""'
    AND table_schema LIKE 'dbt%'
)

SELECT
  SUM(COALESCE(has_description, 0)) / COUNT(*) AS ratio
FROM `<YOUR_DATA_REGION>.INFORMATION_SCHEMA.TABLES`
LEFT JOIN descriptions USING(table_name)
WHERE
  table_catalog = '<YOUR_GOOGLE_PROJECT_NAME>'
  AND table_schema = 'dbt_marts'
Percent of warehouse columns with descriptions
Shows the progress of warehouse table columns that have a description.
We used this SQL query for that:
SELECT
  SUM(IF(description IS NOT NULL AND description != '', 1, 0)) /
    COUNT(*) AS ratio,
FROM `<YOUR_DATA_REGION>.INFORMATION_SCHEMA.COLUMN_FIELD_PATHS`
WHERE
  table_catalog = '<YOUR_DATA_REGION>'
  AND table_schema = 'dbt_marts'
Newly created Metabase questions per data source
Shows the share of newly created questions per month and data source. Excludes questions that use the Metabase database.
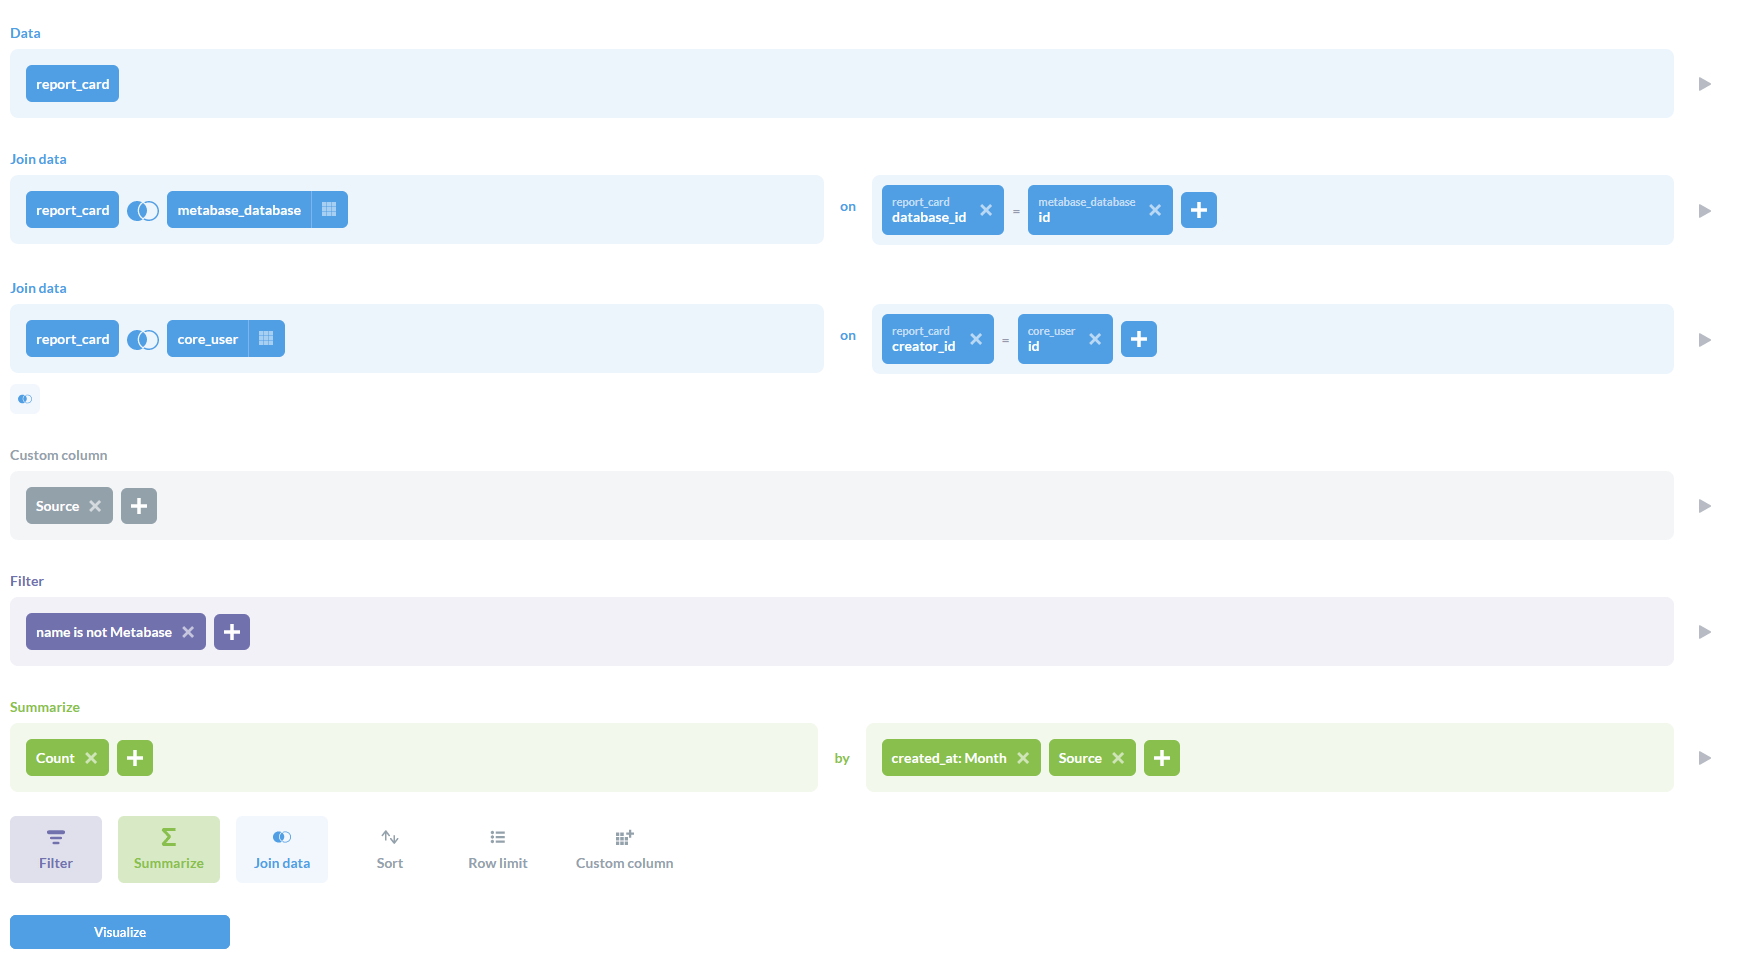
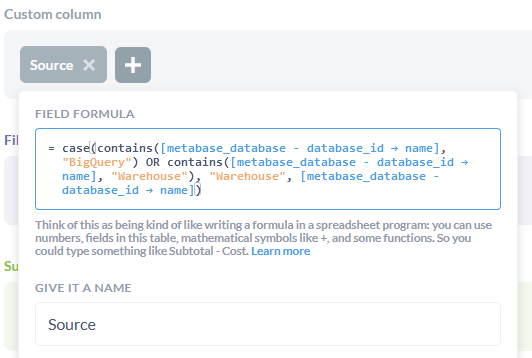
We used the query builder for that:
Final Thoughts: Why OKRs Work for Data Analytics Teams
Implementing OKRs for our data analytics team helped us shift from reactive support (answering endless ad-hoc requests) to proactive enablement (building systems that empower others). We moved closer to becoming a team that drives strategy, not just reports on it.
If your team is overwhelmed with one-off data requests or struggling with alignment, setting OKRs could be the change you need to bring clarity, ownership, and momentum to your work.