




What is list growth rate, and how do you measure it in Metabase?
List growth rate is the net change in your email list per period — new subscribers minus unsubscribes, hard bounces, and pruned addresses, divided by list size. It's the compounding engine behind every other email metric: a list that shrinks quietly caps everything downstream. Measure it in Metabase from subscriber data synced from Klaviyo, Mailchimp, ActiveCampaign, or SendGrid.
(new − unsubscribes − hard bounces − pruned) ÷ list size, per
month, with the components broken out. Net beats gross: signups measure your
forms, net growth measures the list. And gate it with a quality check — a
growing list of subscribers who never open is negative growth in disguise.
What does a list growth rate chart look like in Metabase?
Chart monthly net growth — new subscribers minus unsubscribes, hard bounces, and pruned addresses, over the month's starting list size — as a line. A steady climb of a point or two per month is strong for an established list, and a negative month like February's is usually a cleanup reading as negative growth by construction; annotate it and watch bounce and engagement rates improve after.
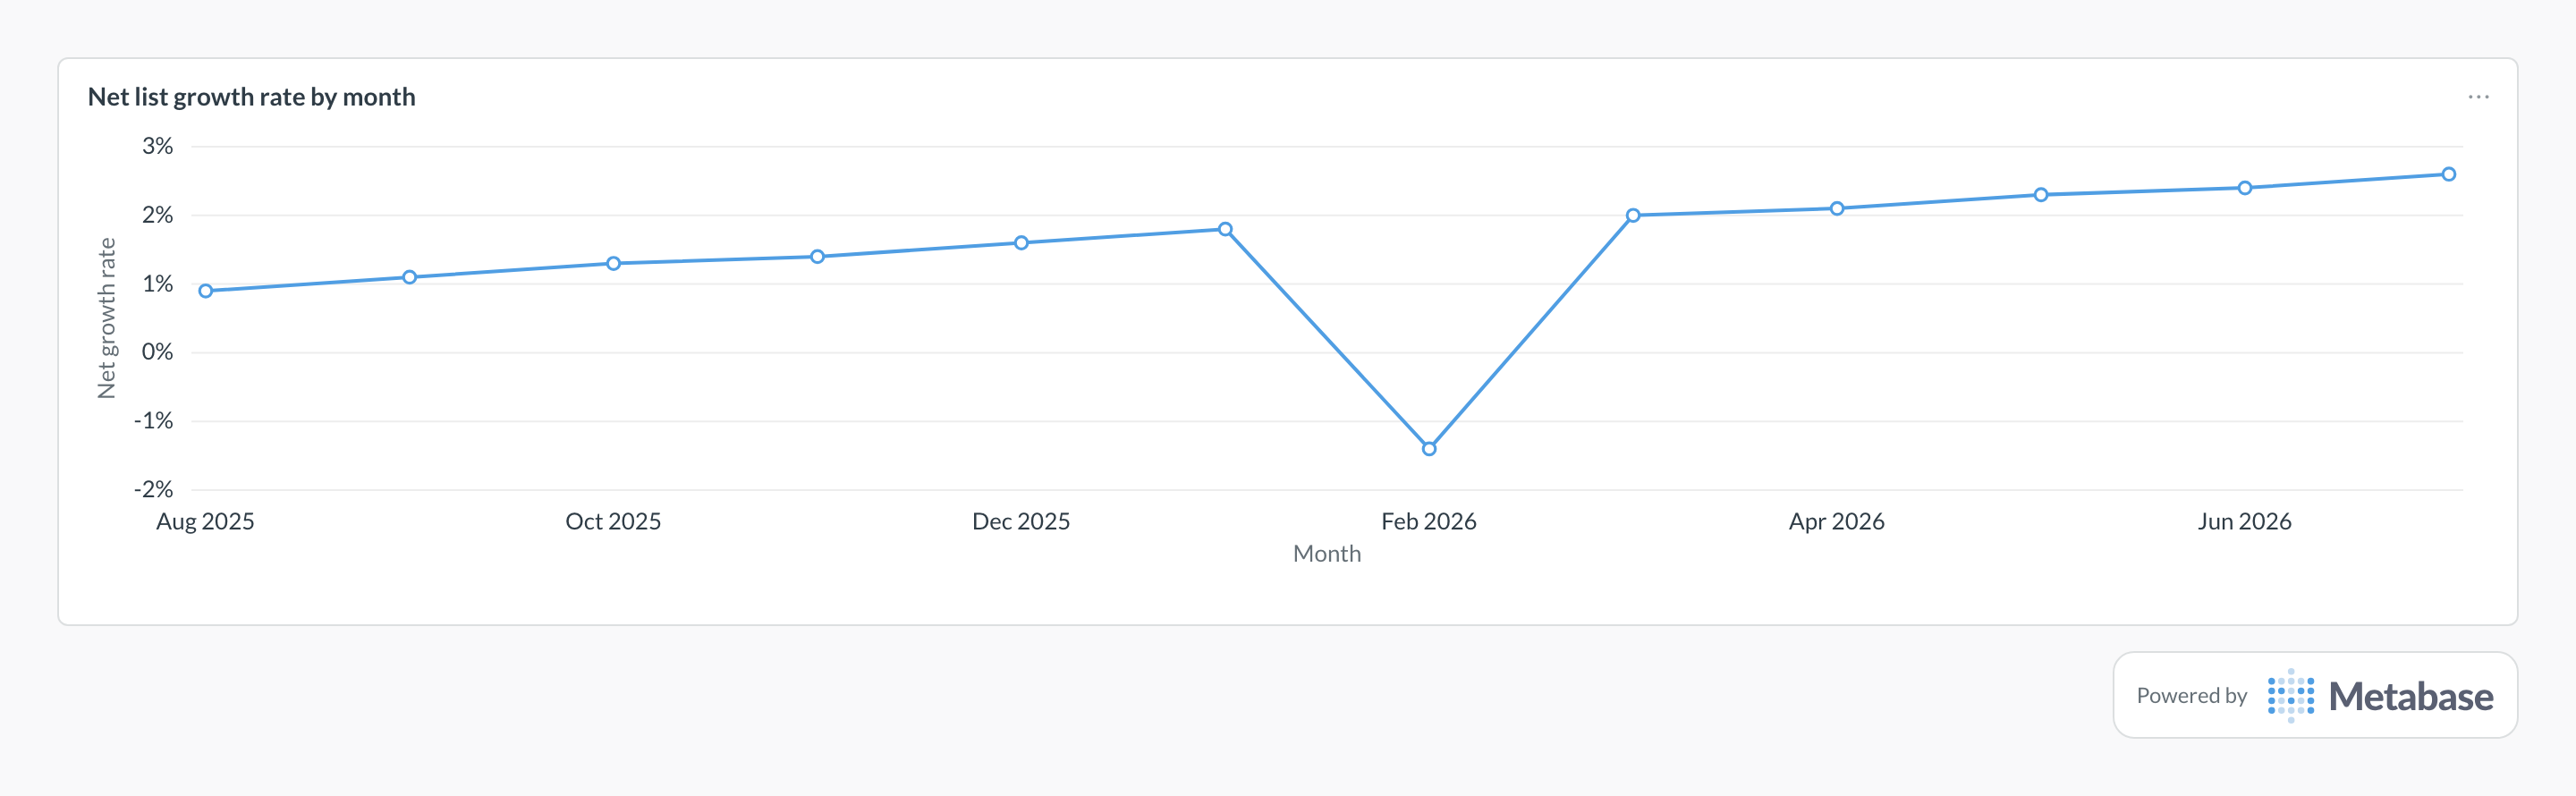
What list growth rate measures
It measures whether your audience is compounding or decaying. Gross growth — raw signups — is a form-performance metric; net growth subtracts everyone who left through the exits (opt-outs, dead addresses, pruning) and tells you what actually happened to the list. Most lists lose 20-30% of subscribers a year to natural decay, so acquisition has to outrun churn just to stay flat.
Two refinements make it a real instrument. First, source attribution: tag every subscriber with the form, page, or channel that acquired them, so growth decomposes into things you can act on. Second, a quality guardrail: compare each new cohort's early engagement against tenured subscribers. Volume from a source whose subscribers never open dilutes engagement rate and drags on deliverability — the list got bigger and worse at the same time.
What data does it need?
-
A subscribers table with
subscribed_at,status, andacquisition_source(form, landing page, channel, import) — synced to your warehouse via Airbyte, Fivetran, or dlt. - Exit events with reasons: unsubscribed, hard bounced, pruned/suppressed — each dated, so components can be trended separately.
- A daily or monthly list-size snapshot (or a running balance modeled from the change events) for the denominator.
- Per-subscriber engagement rollups (opens and clicks in the first 90 days) to score new-cohort quality by source.
SQL patterns
SELECT
  date_trunc('month', d.event_date) AS month,
  SUM(d.new_subscribers) AS new_subscribers,
  SUM(d.unsubscribes)    AS unsubscribes,
  SUM(d.hard_bounces)    AS hard_bounces,
  SUM(d.pruned)          AS pruned,
  SUM(
    d.new_subscribers - d.unsubscribes - d.hard_bounces - d.pruned
  ) AS net_change,
  ROUND(
    100.0 * SUM(
      d.new_subscribers - d.unsubscribes - d.hard_bounces - d.pruned
    ) / NULLIF(
      -- the month's starting balance is the earliest daily snapshot,
      -- not the smallest value the list dipped to during the month
      (array_agg(d.list_size_start ORDER BY d.event_date))[1], 0
    ), 2
  ) AS net_growth_rate_pct
FROM list_changes_daily d
WHERE d.event_date >= CURRENT_DATE - INTERVAL '12 months'
GROUP BY 1
ORDER BY 1;SELECT
s.acquisition_source,
COUNT(*) AS new_subscribers,
ROUND(
100.0 * COUNT(*) FILTER (
WHERE e.opens_90d > 0 OR e.clicks_90d > 0
) / NULLIF(COUNT(*), 0), 1
) AS engaged_90d_pct,
ROUND(
100.0 * COUNT(*) FILTER (WHERE e.unsubscribed_90d)
/ NULLIF(COUNT(*), 0), 2
) AS churned_90d_pct
FROM subscribers s
JOIN subscriber_engagement_90d e ON e.subscriber_id = s.id
WHERE s.subscribed_at >= CURRENT_DATE - INTERVAL '6 months'
AND s.subscribed_at < CURRENT_DATE - INTERVAL '90 days'
GROUP BY 1
ORDER BY engaged_90d_pct DESC;Pitfalls
Where this metric applies
- Klaviyo + Metabase — profile lifecycle and suppression events by source
- Mailchimp + Metabase — audience growth, unsubscribes, and cleaned addresses
- ActiveCampaign + Metabase — contact status changes and list membership
- HubSpot + Metabase — contact lifecycle and email subscription status