In this release
Metabase 0.26
X-Rays
Metabase 0.26
Just like it’s taboo to wear white after Labor Day, it’s also taboo to have Metabase still be at version 0.25 after Labor Day, so we decided we’d better get on that and release a new version. We also made some really cool new stuff, so those two things dovetailed nicely.
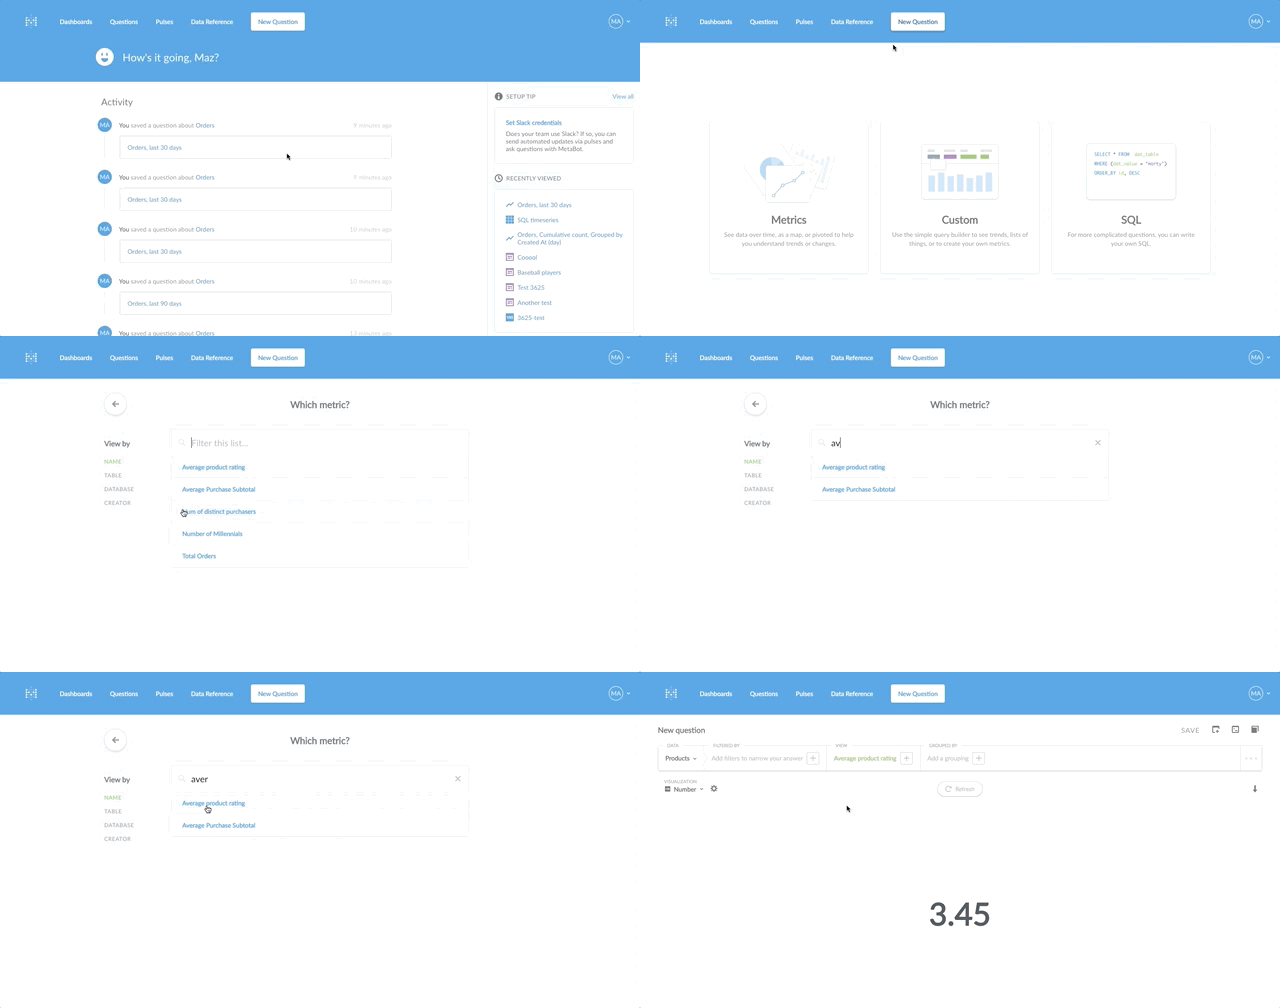
A new New Question flow
We’ve known for a long time that starting an exploration in Metabase is a bit like being thrown into the deep end of the pool. While the graphical interface for querying is a nice alternative for those that don’t know or don’t want to use SQL, it didn’t highlight existing metrics, so it could be hard to know where to start.
We’ve overhauled the flow to provide easier paths to existing metrics in your company’s Metabase, and we’ve also elevated the path to the native query editor to make it faster to start writing queries if that’s your thing.

The doctor would like to go over your x-ray results
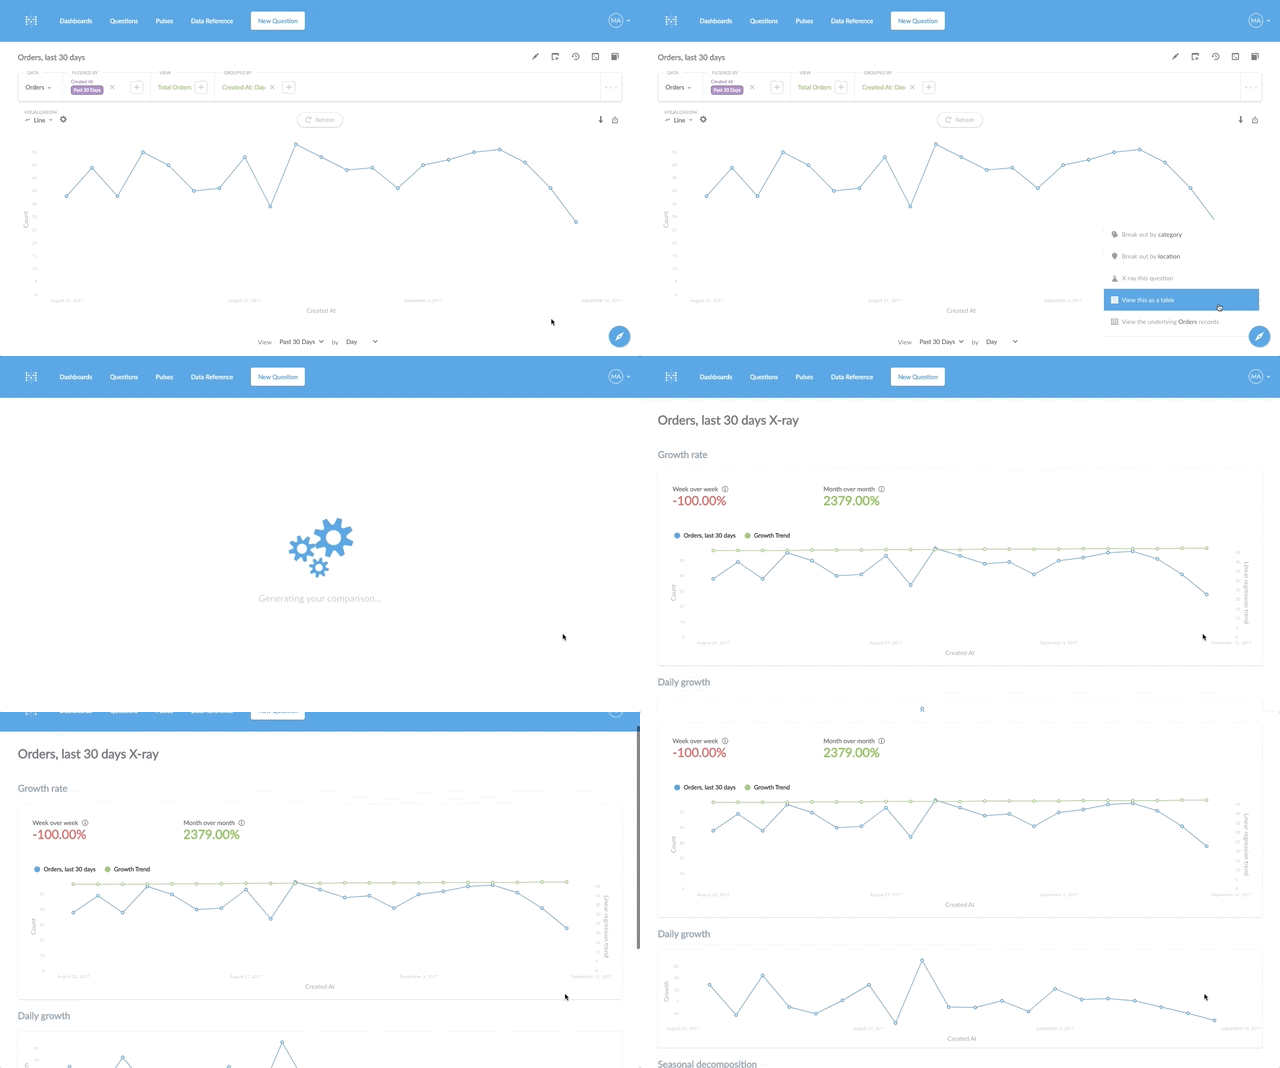
Metabase has always been about trying to make knowledge more accessible to more people with less work, so we’re continuing in that vein by introducing a new feature called X-rays. X-rays try to give you answers to common questions like “what’s the average value of purchase totals?” without having to write a query.
For this first version, you can x-ray fields, tables, segments, and time series questions. Depending on what you’re looking at you’ll see things like the distribution of values by day of week, or the mean, median, and mode of values for a field.
Things start to get even more interesting when you use X-rays to compare segments to tables. Metabase will point out what’s most different between the two entities you’re viewing to help you understand the segment and how it differs from the whole.
My personal favorite feature is when you X-ray a time series question. Depending on the time range, we’ll give you growth rates like week-over-week or year-over-rear, and also show you the overall trend line.
We’re still working on both X-Rays and Comparisons, and there are no doubt a few rough edges. However, we’re excited to get this in your hands sooner rather than later and would love your feedback on how we can improve the usefulness of X-rays.

Smarter syncing
Metabase does some automated analysis on a schedule under the hood to power features like showing values in dashboard or SQL question filters. Previously Metabase would perform these tasks on a set schedule with an hourly light weight analysis and a more in-depth analysis every 24 hours. Now you can control the schedule for these processes to suit your needs, or analyze just a single table or field on demand. We’ve also overhauled the analysis process itself to make it smarter and more powerful.
Where have you bin all our lives?
When grouping a metric by a numeric field, Metabase will now automatically “bin” the numeric field into ranges that make sense for your results. For example, if you have Users by Age, you’ll see the ages grouped into bins like 18–27, 28–37, 38–47, and so on. And if you don’t like the bins Metabase chose, you can change them to your liking. Binning looks especially nice with bar charts, allowing you to create histograms.
In the (time) zone
We’ve also done a bunch of work for this release to try and fix some persistent issues with time zones. You can follow along with all the work we did on that front here. We’ve also updated the timezones troubleshooting guide with some handy common fixes.
To see the other things we fixed and updated, check out the full release notes.
We’ll see you soon for 0.27. As always, thanks for using Metabase.
Share this release
See previous releases
All releasesGet started with Metabase
- Free, no-commitment trial
- Easy for everyone—no SQL required
- Up and running in 5 minutes


