


Building a data portfolio used to mean choosing between local notebooks or complex cloud struggles. Thankfully, that era is over. With containerization fully matured, I leveraged Docker to encapsulate the entire project, ensuring it wasn’t just code on my laptop, but a reproducible environment ready for production.
This technical stability gave me the freedom to attempt a unique form of digital archaeology. We usually build modern data stacks to analyze the present, but they are equally powerful for reconstructing the past. I wanted to take the engineering rigor we have today and apply it to a legendary narrative that had never been properly measured.
If you’re a football fan, you’ve heard about the 2011/12 Premier League finale: Agüero’s goal at 93:20, the goal difference battle with United, and absolute chaos as Manchester City snatched the title from Manchester United.

My goal: take scattered historical data from that season (via web scraping) and transform it into interactive sports intelligence—the kind of dashboard that lets you explore not just what happened, but why and how the championship unfolded week by week.
But here’s the challenge: in 2012, football was watched, but there were no modern football analytics or data tracked like today.
We didn’t have advanced metrics, passing networks, or the data granularity we expect in 2026. The drama was preserved on video, but the data remained fragmented or silent. As a data engineer, I asked myself: Can we apply today’s technology to decode yesterday’s history, and make it explorable through visualization?
The stack: choosing the right tools
To answer this question, I needed a robust stack. My chosen tools were:
- Python
- PostgreSQL
- Docker
- Metabase
- Digital Ocean
- Caddy
Python and PostgreSQL were deliberate choices because they form a reliable, industry-proven foundation for analytics workflows. Python offers flexibility and speed for data collection and transformation, while PostgreSQL provides strong relational modeling, SQL expressiveness, and long-term stability for analytical queries. The rest of the stack plays different roles: Docker ensures the entire system is reproducible across environments, Metabase exposes the data through interactive dashboards without additional backend code, and Caddy handles secure access with minimal operational overhead.
Together, these tools create a lightweight but production-like architecture that’s easy to reason about and extend, and, for someone starting in data, this containerized stack makes it easy to move from localhost to production, turning a data engineering side project into a live project that proves you can build end-to-end.
Ingesting and storing football history
The first challenge was data collection. This season comes from a time when “Big Data” wasn’t standard in football.
I built Python scripts to scrape historical match events and statistics, then ingested everything into a PostgreSQL database.
Instead of installing Postgres locally, I defined it as a service in docker-compose.yml. This allowed the database to persist in Docker volumes and made the entire setup reproducible across machines and environments.
At this point, the project was already portable but still local.
Orchestrating and securing the stack
To make the project public, I deployed the stack to a DigitalOcean Droplet (a simple VPS).
This introduced a familiar problem: How do you expose a data application securely without spending days on configuration?
The solution was adding Caddy as a reverse proxy inside the Docker stack. Caddy automatically obtains and renews Let’s Encrypt certificates for your domain. With almost no configuration, I had HTTPS in front of the BI layer, while keeping the database private inside the Docker network.
This single decision removed a huge amount of operational friction and wasted effort.
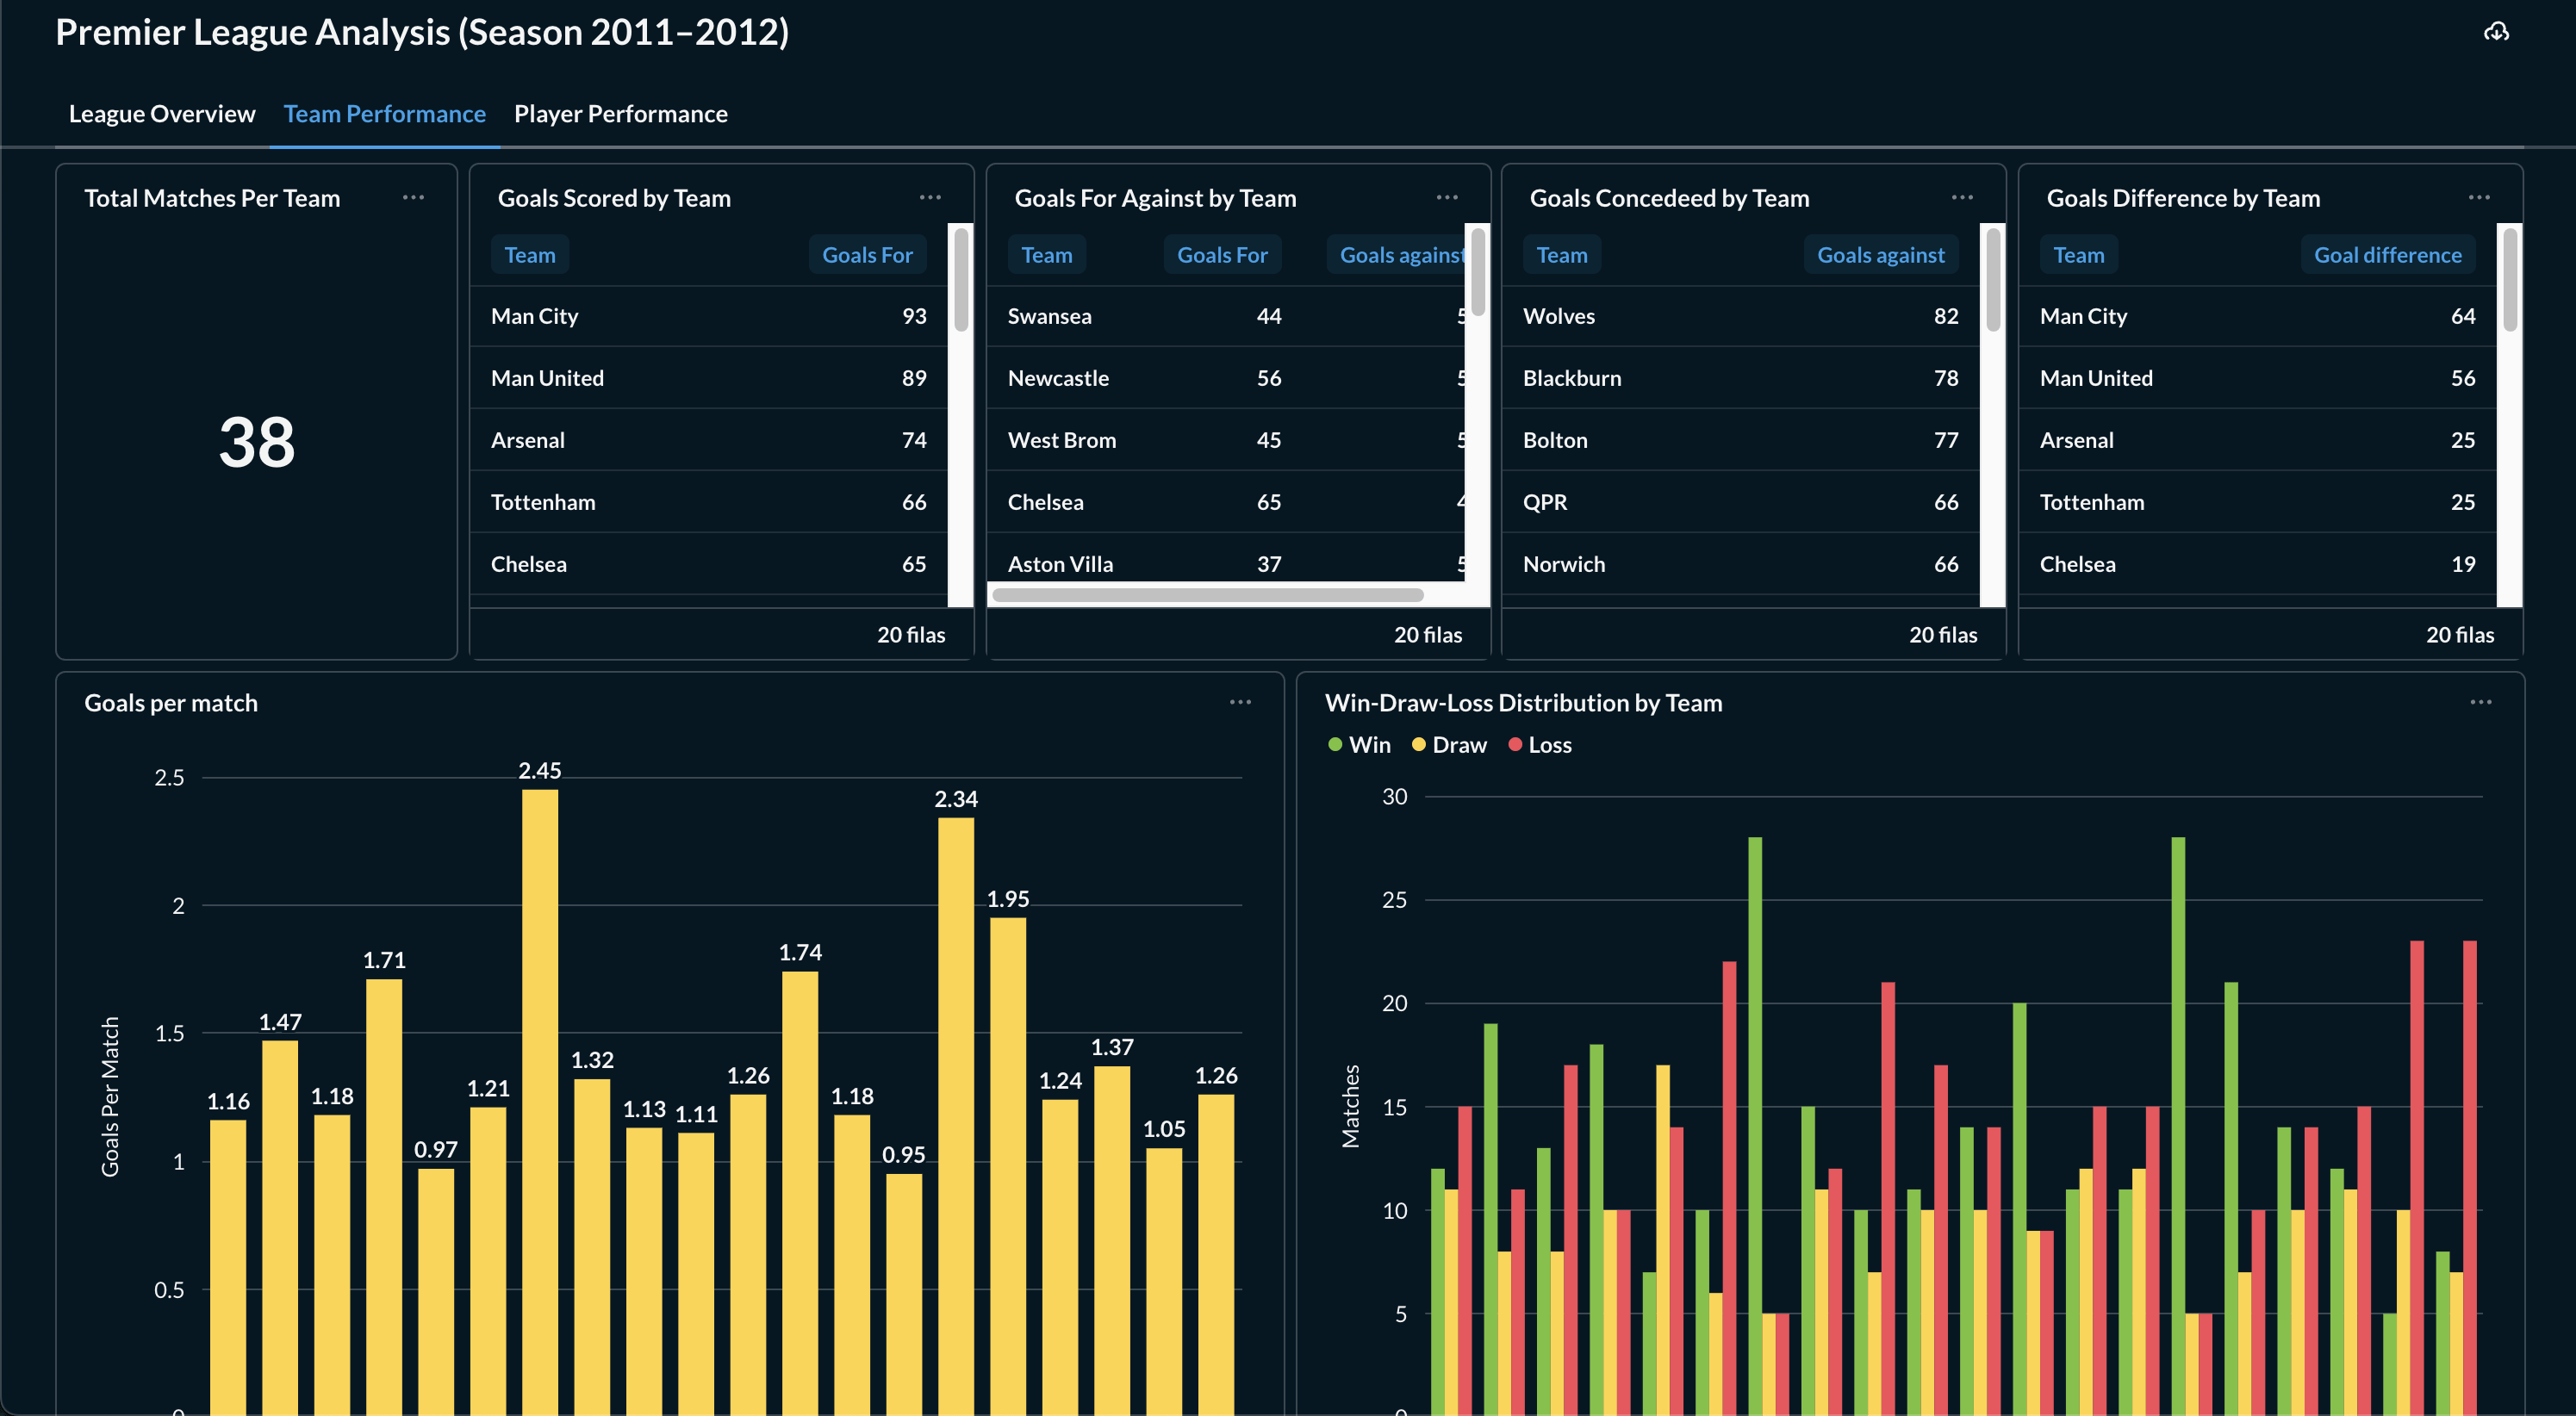
Visualizing the narrative with Metabase
With the infrastructure in place, I connected Metabase to the Dockerized PostgreSQL instance and started exploring the data.
Writing SQL queries to analyze the goal-difference battle between Manchester City and Manchester United was straightforward, and when I wanted to move faster or iterate on ideas, the graphical query builder made it easy to explore the same data without leaving the context of the question.
As insights emerged, I saved key questions and reused them as building blocks across the dashboard. This made it simple to refine metrics, compare teams, and extend the analysis over matchdays without rewriting queries from scratch.
Using Metabase’s field filters, those questions became interactive dashboards where users can explore:
- Teams
- Players
- Matchdays
- Season-long momentum
The result felt less like a static report and more like a time machine, a way to relive the season through data.
3 tips for shipping your own data engineering side project
As someone starting my career in data engineering, side projects have been a great way to build both skills and a portfolio. And to close out this post, I want to share 3 tips to deploy your stack that I learned the hard way:
- Don’t hardcode credentials Use a .env file for database passwords in Docker Compose. You really don’t want to accidentally push secrets to GitHub.
- Map your ports intentionally 5432:5432 exposes your database to the world. In production, you’ll usually want to expose only your web server (80/443) and keep the database private inside the Docker network.
- Just ship it It doesn’t have to be perfect. My first version had bugs and connection issues, but fixing those problems on a real Linux server taught me more than any tutorial ever could.
Final thoughts: learning by shipping
Most of the learnings from this project came from connecting the pieces and dealing with real challenges rather than following tutorials. Writing the ingestion logic in Python quickly exposed the need for idempotent scripts and a clean separation between extraction and loading, while modeling the data in PostgreSQL pushed me to think beyond raw tables and use views to make analytics simpler and closer to real questions.
The biggest shift happened once everything left my laptop: containerizing the stack with Docker and deploying it on DigitalOcean surfaced challenges around persistence, networking, and security that don’t exist in local-only projects. Metabase became the interface that made the entire project accessible; thanks to it, anyone can explore the season’s drama through filters, comparisons, and visualizations. Shipping the project end-to-end is what ultimately turned individual tools into a cohesive system, and that’s where most of the real learning happened.