What is a histogram?
A histogram is a chart that displays continuous data using vertical bars that each represent a discrete, equal-sized range. These ranges are called bins.
While bar charts are used to visualize categorical information (like product categories), histograms display information along a spectrum, separated into binned ranges. If your data is numerical — say, price or quantity — consider opting for a histogram.
Example histogram
You could use a histogram to visualize a count of orders broken down by subtotal, like so:
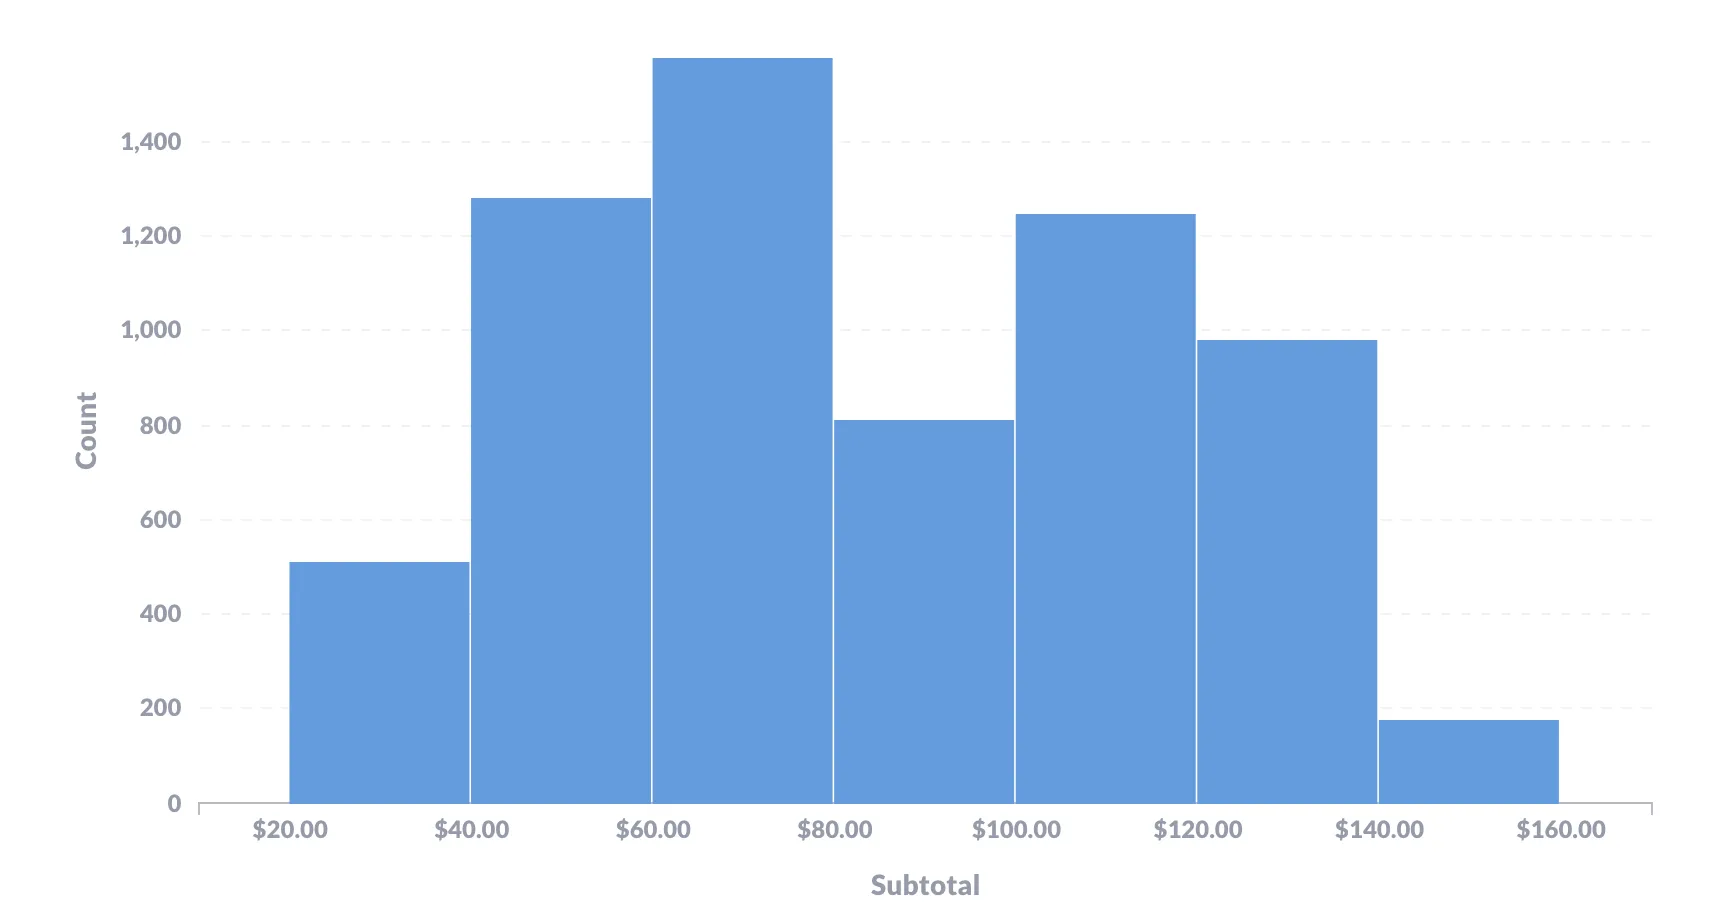
Histograms will only show a thin sliver of white space between each of the bins to indicate that the bars represent bins across a range of continuous values.