





What is a customer health score, and how do you build one?
What does a health score chart look like in Metabase?
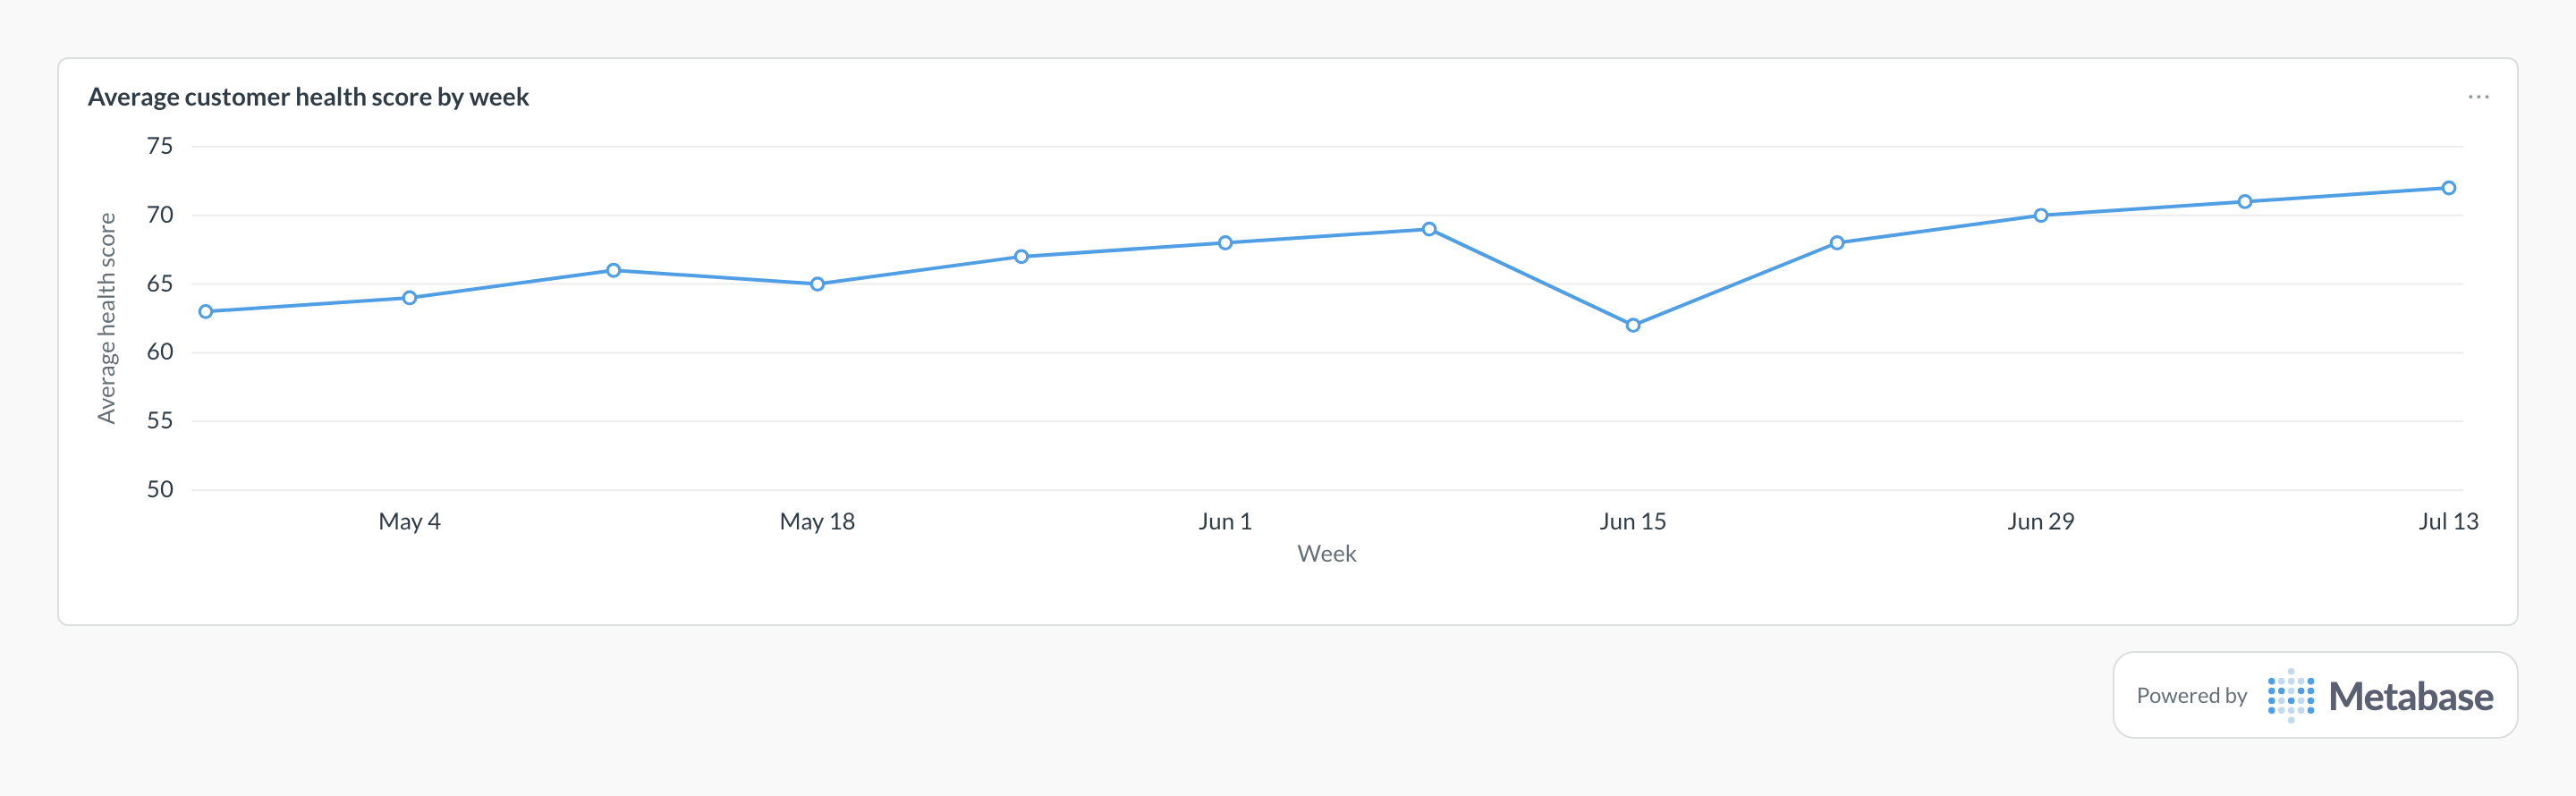
Plot the book’s average health score by week and read the direction rather than the level — the level is an artifact of your weights, while a steady climb means adoption and engagement are genuinely compounding. A one-week drop like Jun 15’s usually traces to a single component, here a burst of support escalations, which is exactly why the components stay visible as separate columns.
Definition
A customer health score is a composite indicator of how likely an account is to keep paying and expand — usually a 0–100 number built from product usage, support experience, relationship depth, and commercial signals. It is a model, not a measurement: the score is only as good as its components, its weighting, and your ability to explain both to the CSM who has to act on it.
What data do you need?
- Product usage at account grain (active users, key events, breadth of feature use)
- Adoption relative to entitlement — seats used vs. seats purchased
- Support signals: open tickets, escalations, response and resolution times
- Relationship signals: exec sponsor present, last QBR, last touchpoint
- Commercial signals: payment status, contract length, expansion history
- A scored_at date so every score is a point-in-time row, never overwritten
SQL pattern
-- Each component is normalized to 0-100 first, then weighted.
-- Keep the components as columns so a CSM can see *why* a score moved.
WITH usage AS (
  SELECT
    account_id,
    SUM(active_users) AS active_user_days,
    COUNT(DISTINCT usage_date) FILTER (WHERE active_users > 0) AS active_days
  FROM product_usage_daily
  WHERE usage_date >= CURRENT_DATE - INTERVAL '28 days'
  GROUP BY account_id
), components AS (
  SELECT
    a.account_id,
    -- Adoption: seats active vs. seats purchased, capped at 100.
    LEAST(
      100.0 * COALESCE(u.active_user_days, 0)
        / NULLIF(a.licensed_seats * 28.0, 0), 100.0
    ) AS adoption_score,
    -- Engagement: share of the last 28 days with any activity.
    100.0 * COALESCE(u.active_days, 0) / 28.0 AS engagement_score,
    -- Support: 100 with no escalations, falling 20 points per escalation.
    GREATEST(100.0 - 20.0 * COALESCE(t.escalations_90d, 0), 0.0)
      AS support_score,
    -- Relationship: decays after 90 days without a logged touchpoint.
    GREATEST(
      100.0 - (CURRENT_DATE - COALESCE(a.last_touchpoint_date,
        CURRENT_DATE - 180)) * 100.0 / 180.0, 0.0
    ) AS relationship_score
  FROM cs_accounts a
  LEFT JOIN usage u USING (account_id)
  LEFT JOIN support_ticket_rollups t USING (account_id)
  WHERE a.status = 'active'
)
SELECT
  account_id,
  ROUND(adoption_score, 1) AS adoption_score,
  ROUND(engagement_score, 1) AS engagement_score,
  ROUND(support_score, 1) AS support_score,
  ROUND(relationship_score, 1) AS relationship_score,
  ROUND(
    0.35 * adoption_score
    + 0.25 * engagement_score
    + 0.20 * support_score
    + 0.20 * relationship_score, 1
  ) AS health_score
FROM components
ORDER BY health_score;
Common pitfalls
Where does this metric apply?
This metric commonly uses data from Gainsight, Vitally, Planhat, Salesforce, HubSpot, plus any warehouse models built on account, subscription, and product-usage tables at the same grain.