




What is Net Promoter Score (NPS), and how do you calculate it?
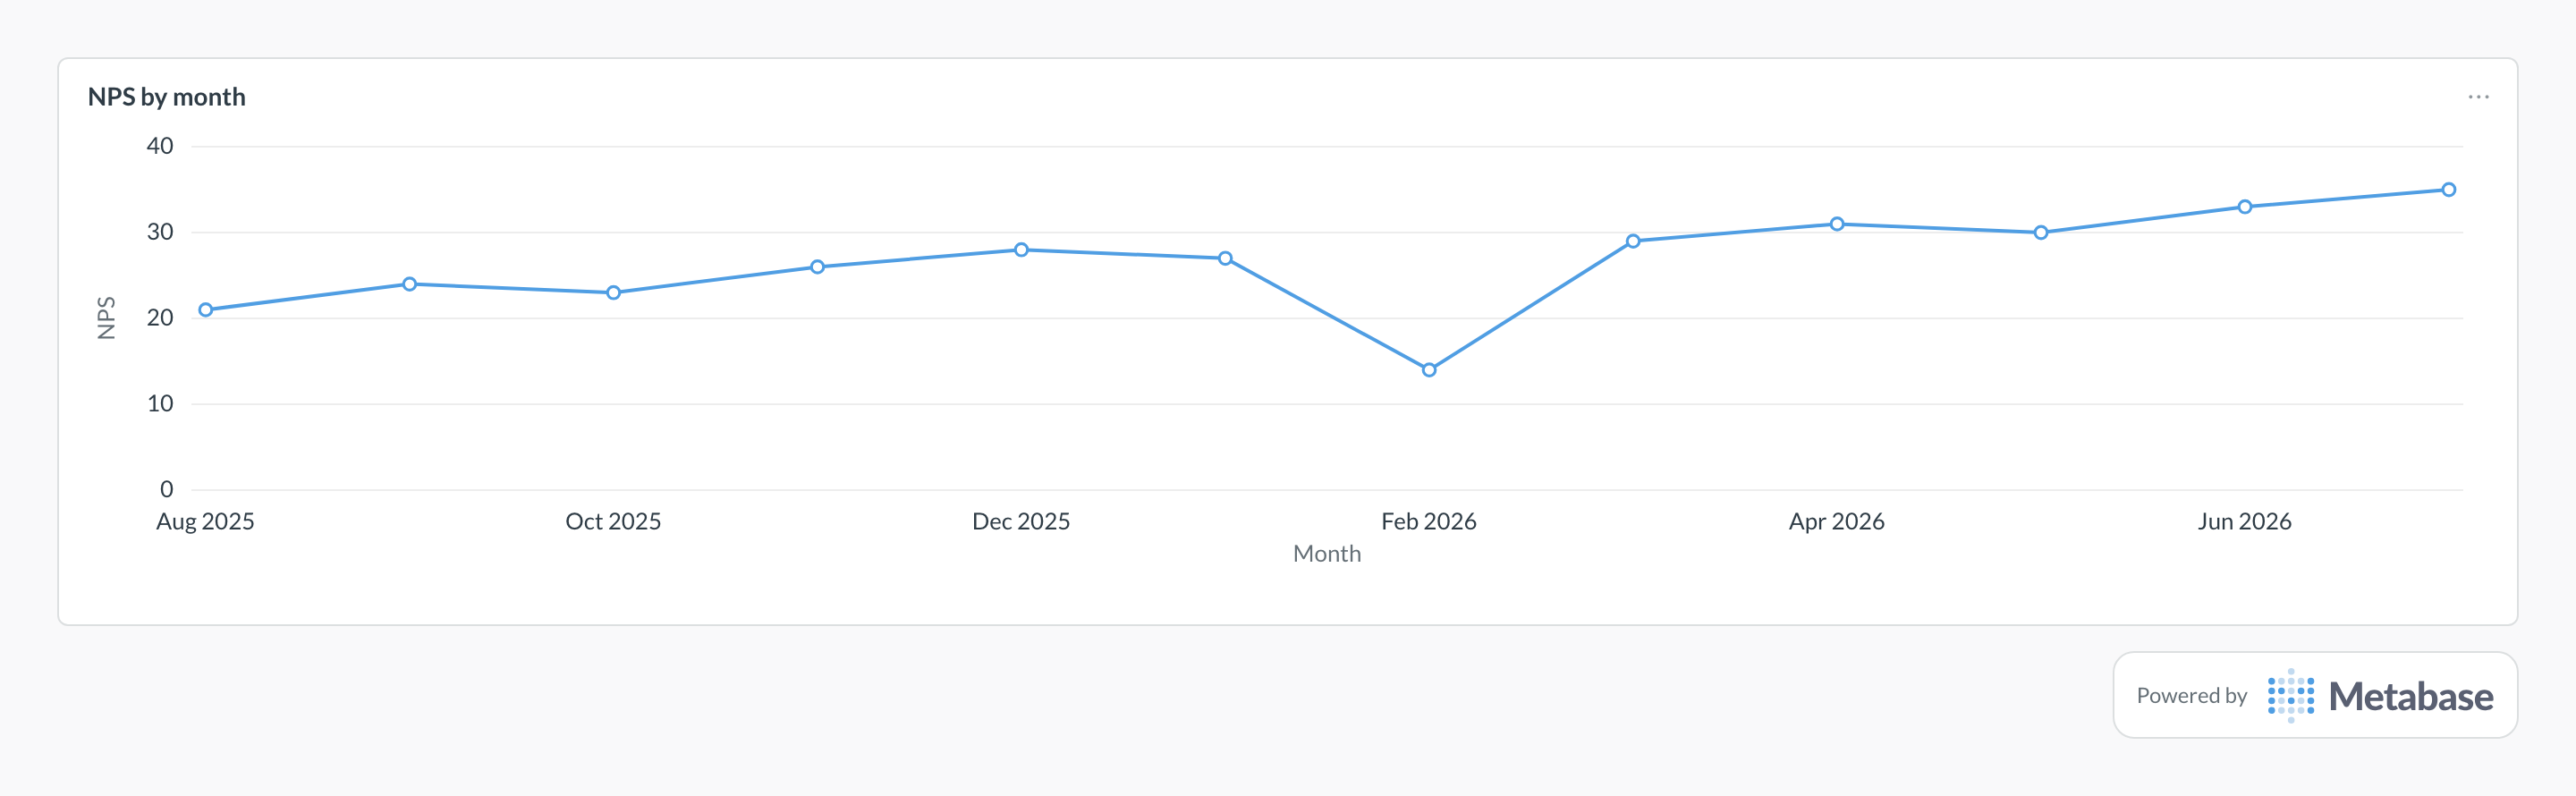
What does a Net Promoter Score chart look like in Metabase?
Plot the monthly score as a line and read the slow climb, not any single month — loyalty moves in quarters, and the trend is what survives sample noise. A one-month drop like February's usually means a detractor wave with a specific cause, a rough release or a pricing change, so check the response volume and verbatims behind it before reacting.
Definition
Net Promoter Score measures customer loyalty from one question — "how likely are you to recommend us?" — answered on a 0-10 scale. Respondents scoring 9-10 are promoters, 7-8 are passives, and 0-6 are detractors; the score is the percentage of promoters minus the percentage of detractors, ranging from -100 to +100.
What data do you need?
- Response-grain data with the raw 0-10 score
- Response timestamps for trending
- Account or user joins for segmentation
- Survey and channel fields (in-app vs. email waves differ)
- Enough volume per segment — small samples swing wildly
SQL pattern
SELECT
  date_trunc('month', submitted_at) AS month,
  COUNT(*) AS responses,
  ROUND(
    100.0 * (
      COUNT(*) FILTER (WHERE score >= 9)
      - COUNT(*) FILTER (WHERE score <= 6)
    ) / NULLIF(COUNT(*), 0), 1
  ) AS nps
FROM nps_responses
GROUP BY 1
ORDER BY 1;
Common pitfalls
Where does this metric apply?
This metric commonly uses data from Pendo, Qualtrics, SurveyMonkey, Typeform, Tally, plus any warehouse models that provide the same grain.