




What is survey response rate, and how do you measure it?
What does a survey response rate chart look like in Metabase?
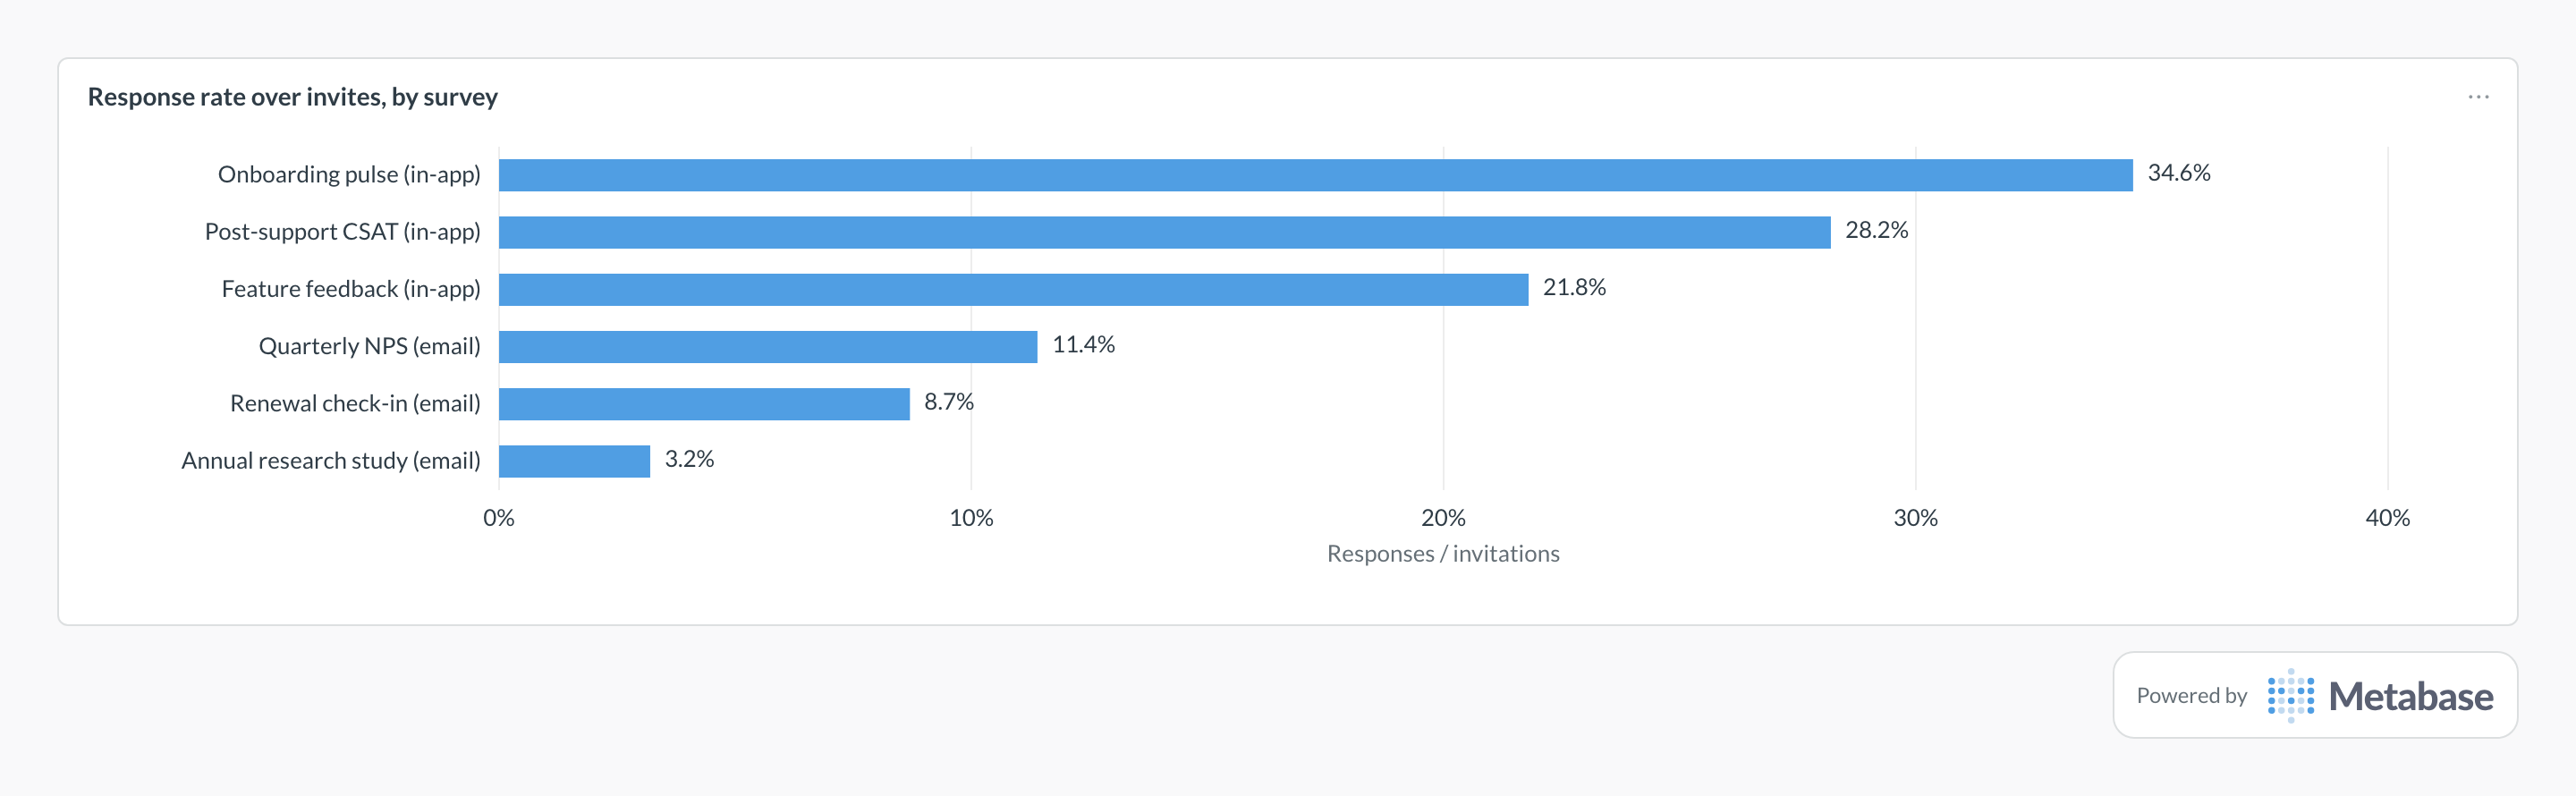
Rank each survey's responses over invitations and the shape to read is the channel split — in-app prompts cluster far above email waves, so compare each survey with its channel peers rather than across the board. The outlier at the bottom, an annual research study at 3.2%, is what a 24-question ask does to willingness to even start.
Definition
Survey response rate is the share of invited people who responded. The number is only meaningful with an explicit denominator: responses over sends, over opens, and over views are three different metrics that can differ by an order of magnitude.
Formula: Response rate = responses / invitations (or opens, or views — pick one and label it)
What data do you need?
- Response counts per survey, channel, and period
- Invitation, open, or view counts from the same tool
- Channel field (email, in-app, link) per response
- Audience segment fields for fair comparison
- Send timestamps to align responses to waves
SQL pattern
Response rate by survey with an explicit denominator PostgreSQL
SELECT
  s.name AS survey,
  s.invited_count,
  COUNT(r.id) AS responses,
  ROUND(
    100.0 * COUNT(r.id) / NULLIF(s.invited_count, 0), 1
  ) AS response_rate_over_invites
FROM surveys s
LEFT JOIN survey_responses r ON r.survey_id = s.id
GROUP BY s.name, s.invited_count
ORDER BY response_rate_over_invites DESC;
Common pitfalls
Comparing rates with different denominators. → A rate over opens will always beat a rate over sends. Standardize one denominator in the warehouse and label it on every card.
Ignoring non-delivery. → Bounced emails and users who never saw the in-app prompt inflate the denominator. Subtract undelivered invitations where the tool reports them.
Reading segment differences as sentiment. → Busy enterprise admins respond less than engaged startups regardless of satisfaction. Compare within segments, not across them.
Where does this metric apply?
This metric commonly uses data from SurveyMonkey, Typeform, Qualtrics, Tally, plus any warehouse models that provide the same grain.
Related
Dashboards
Integrations
Metrics
Analytics
FAQ
What is a typical survey response rate?
Email surveys to customers commonly land in single digits to the low tens of percent; in-app microsurveys can run far higher. The spread is why trending your own rate per channel beats chasing external benchmarks.
Does response rate matter if I have enough responses?
Yes — a low rate raises non-response bias risk: the people who answered may differ systematically from those who didn't. Report the rate alongside results so readers can judge representativeness.