




What is survey completion rate?
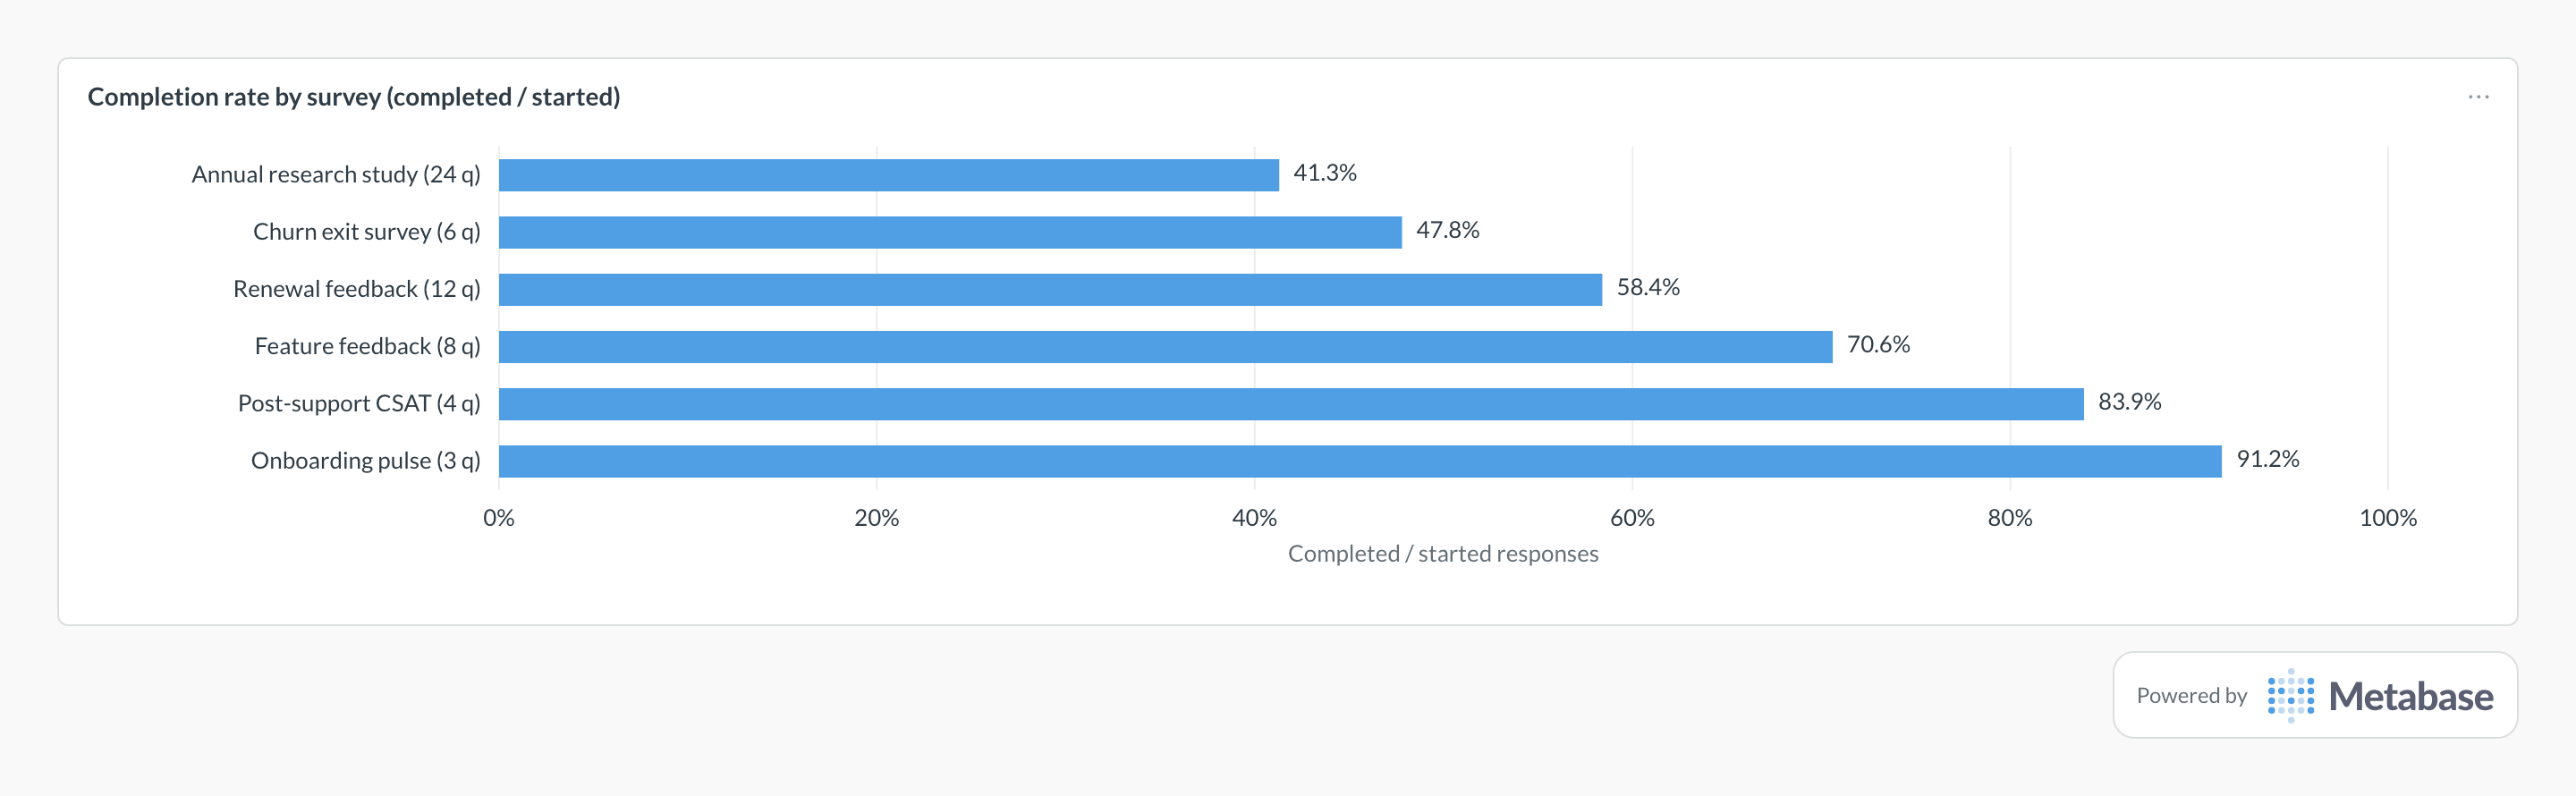
What does a survey completion rate chart look like in Metabase?
Completion tracks length almost mechanically — every added question shaves the rate, which is why a 24-question research study finishes under half while a three-question pulse clears 90%. The bar worth investigating is the churn exit survey: at six questions it should complete far above 47.8%, and a short survey completing low usually means a broken question or a mobile rendering problem.
Definition
Survey completion rate is the share of people who started a survey and reached the end. Where response rate measures whether the invitation worked, completion rate measures whether the questionnaire itself holds attention — and drop-off by question shows exactly where it doesn't.
What data do you need?
- Response records with started and submitted timestamps
- A completed flag or last-question-reached field
- Question count and position metadata per survey
- Device field — completion differs sharply on mobile
- Answer-grain data for drop-off-by-question analysis
SQL pattern
SELECT
  s.name AS survey,
  s.question_count,
  COUNT(r.id) AS started,
  ROUND(
    100.0 * COUNT(r.id) FILTER (WHERE r.completed)
    / NULLIF(COUNT(r.id), 0), 1
  ) AS completion_rate,
  percentile_cont(0.5) WITHIN GROUP (
    ORDER BY EXTRACT(EPOCH FROM (r.submitted_at - r.started_at))
  ) AS median_seconds_to_complete
FROM surveys s
JOIN survey_responses r ON r.survey_id = s.id
GROUP BY s.name, s.question_count
ORDER BY completion_rate ASC;
Common pitfalls
Where does this metric apply?
This metric commonly uses data from Typeform, SurveyMonkey, Qualtrics, Tally, plus any warehouse models that provide the same grain.