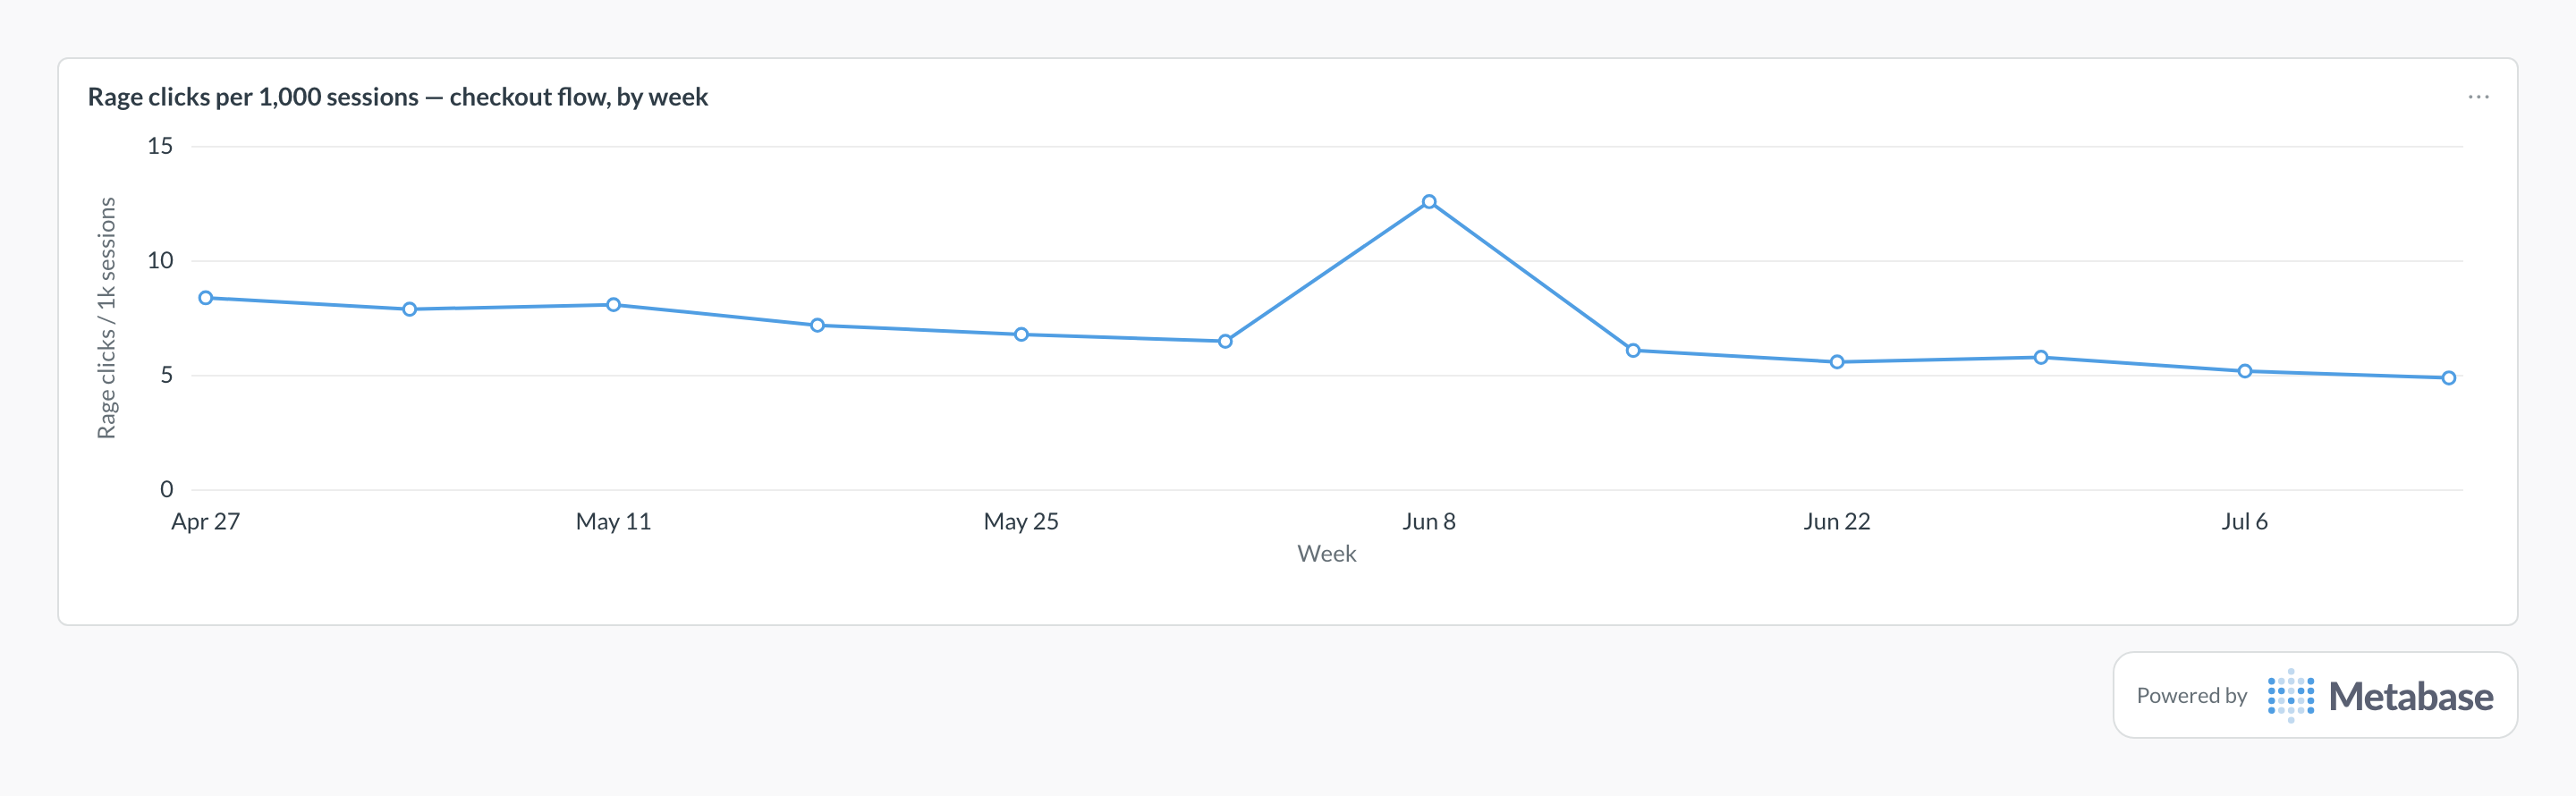
What does a rage-click rate chart look like in Metabase?
Trend rage clicks per 1,000 sessions for one page or flow against its own baseline — the slow drift down is dead UI getting found and fixed. A step spike like Jun 8's is the actionable pattern: it almost always lands right after a deploy, so join release markers to the week and pull that page's session replays to see what broke.
Rage-click rate as a Metabase card, built from
synced session intelligence data. Figures are
illustrative.
Definition
Rage-click rate measures how often users rapidly click the same element — the canonical digital frustration signal, captured by session intelligence tools. Normalized per session or per 1,000 sessions, it turns individual replay moments into a trendable metric that flags broken interactions and dead UI.
Formula: Rage-click rate = rage-click events / sessions (often scaled per 1,000 sessions), per page or flow
What data do you need?
Daily session rollups per page or flow with rage-click counts
Session counts on the same rollups as the denominator
Device and browser dimensions — many rage patterns are platform-specific
Release or deploy markers to correlate spikes with changes
Companion signals where available: dead clicks, error clicks
SQL pattern
Rage clicks per 1,000 sessions by page and weekPostgreSQL
SELECT
  page_or_flow,
  date_trunc('week', usage_date) AS week,
  SUM(sessions) AS sessions,
  ROUND(
    1000.0 * SUM(rage_clicks) / NULLIF(SUM(sessions), 0), 2
  ) AS rage_clicks_per_1k_sessions
FROM session_rollups
GROUP BY 1, 2
ORDER BY 1, 2;
Common pitfalls
Ranking pages by raw rage-click counts.→ High-traffic pages always win raw counts. Normalize per session (or per 1,000) before comparing pages.
Treating every rage click as a bug.→ Some UI invites multi-clicking (tables, steppers, maps). Trend each page against its own baseline and investigate changes, not levels.
Watching rage clicks without release context.→ The actionable pattern is a step change after a deploy. Join release markers to the trend so spikes point at their cause.
Where does this metric apply?
This metric commonly uses data from Fullstory, LogRocket, Contentsquare, plus any
warehouse models that provide the same grain.
Each tool has its own detection (typically 3+ clicks on the same target within a second or two). Don't re-derive it from raw events — use the tool's classification and keep tool-specific rates in separate columns if you run more than one.
What should I do when the rate spikes?
Go from the Metabase trend to the source tool's session replays for the affected page — the aggregate finds the where, replay shows the what. Fixes usually turn out to be dead buttons, slow feedback, or misleading affordances.