5 min read
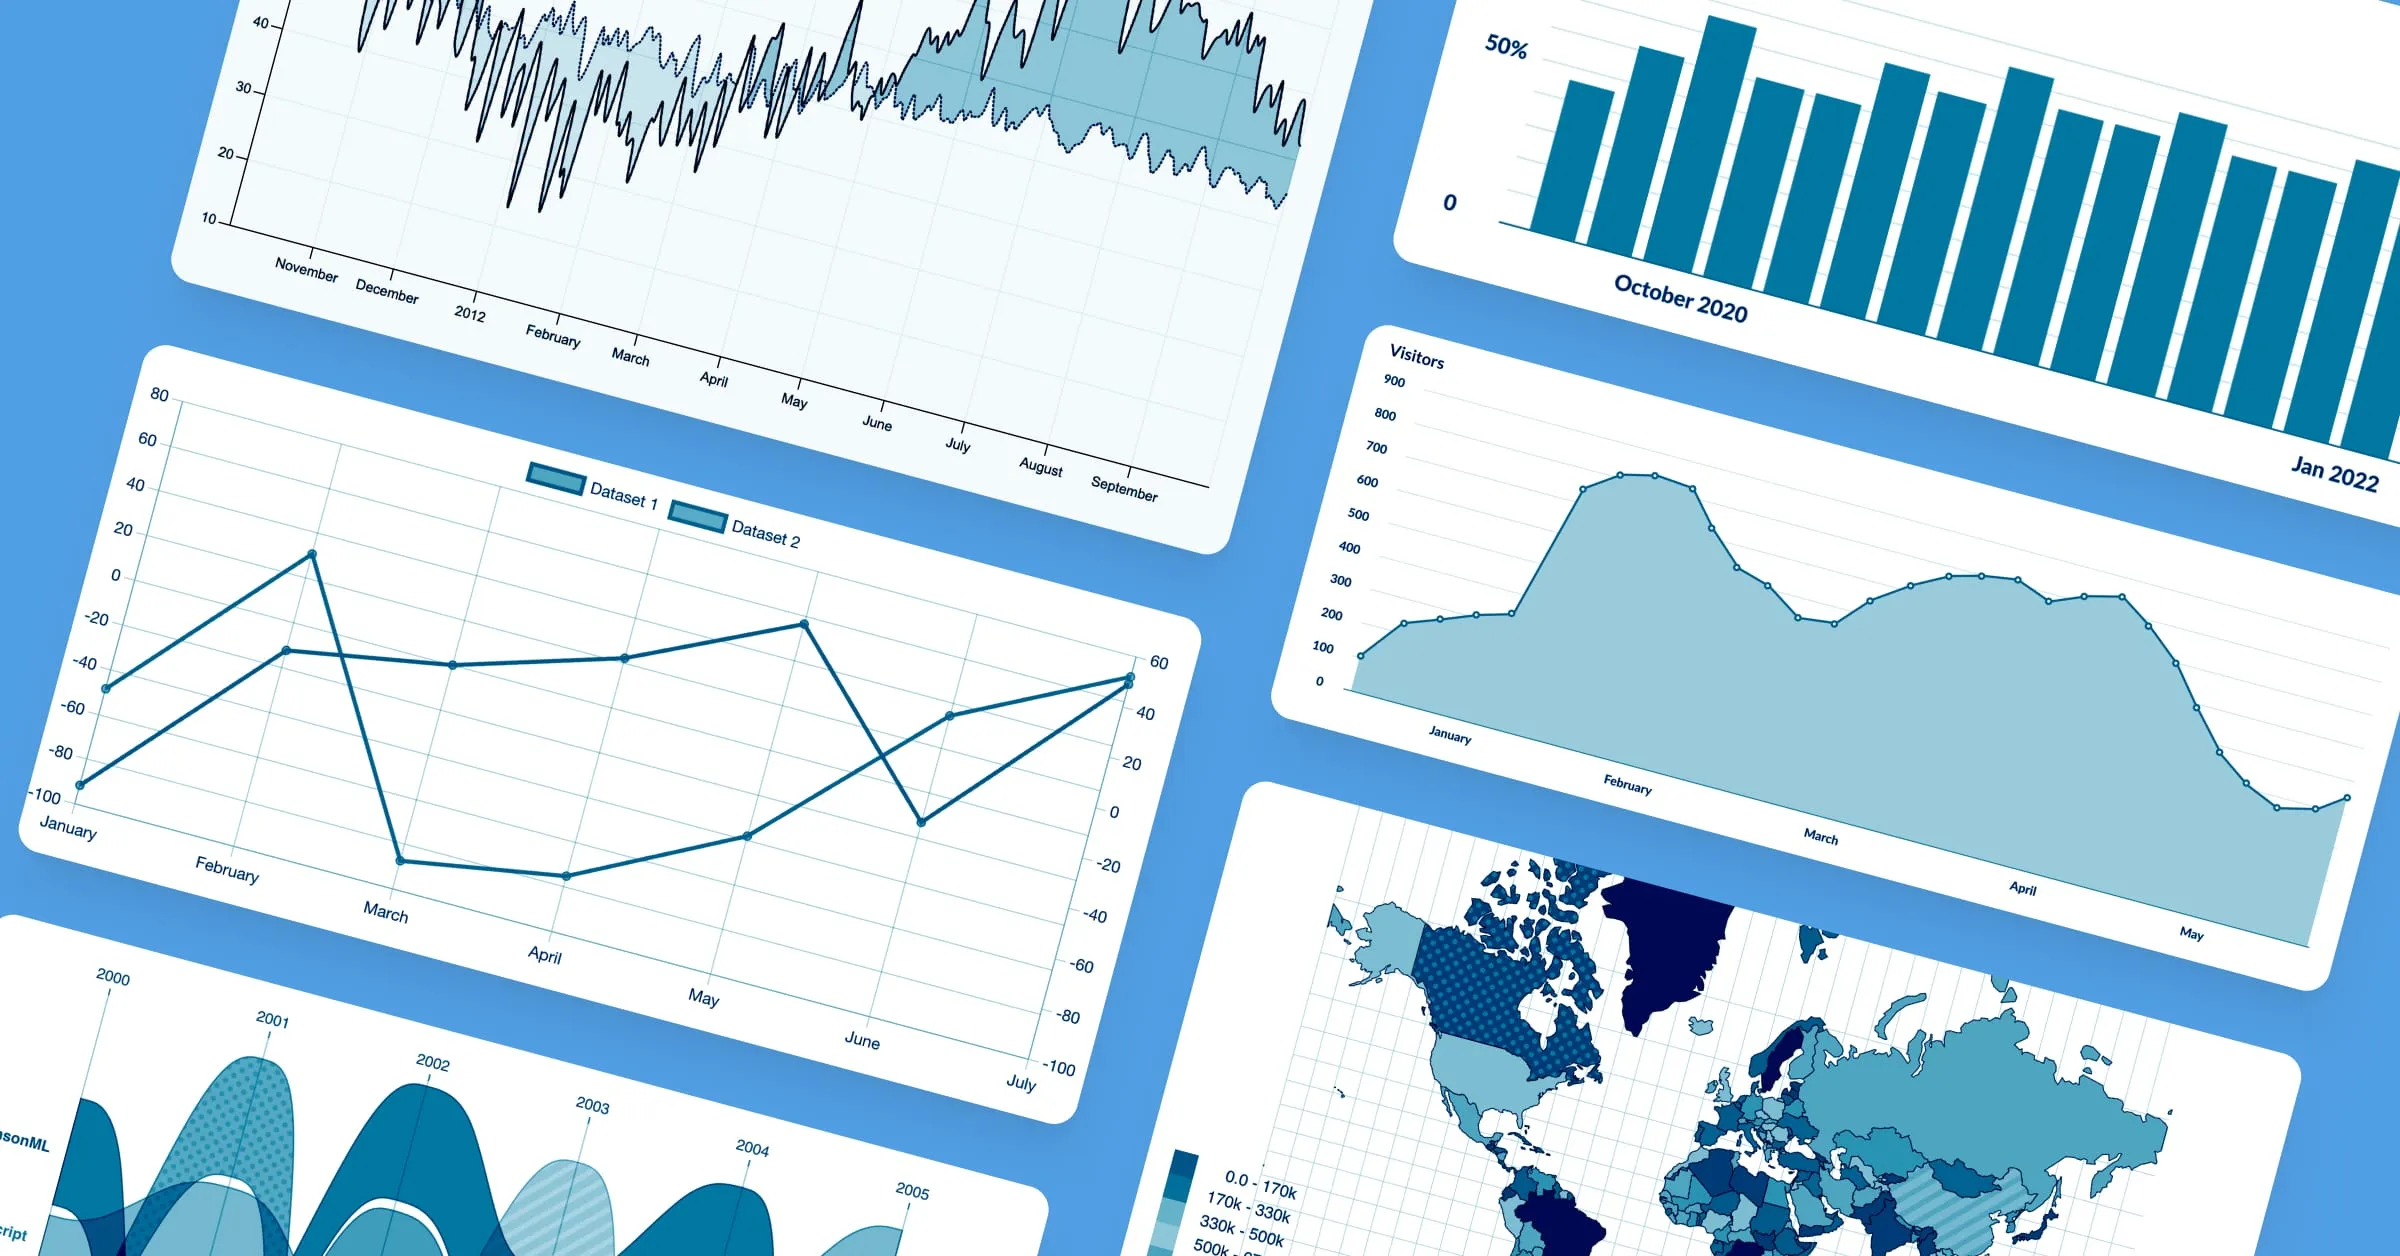
Here’s a breakdown of some of the most popular charting libraries to help you figure out which library could be best for your embedding project, as well as a discussion about when you should consider a more batteries-included solution.
Chart.js is an open-source JavaScript visualization library that started in 2013 and, over time, has ranked as the most popular charting library according to GitHub stars and npm downloads.
Chart.js might be right for you if you:
parsing: true and it’ll parse your data for you.The brainchild of Airbnb’s Engineering and Data Science team, visx is a collection of expressive, low-level visualization primitives for React.
While visx isn’t technically a visualization library, it helps you build your own charting using visualization primitives. visx bundles D3 and React to give you the bare bones of charting while keeping the animations, theming, and styling you’re already using for your app.
visx might be right for you if you need to:
Nivo is built on top of D3 as a set of React components to offer server side rendering and fully declarative charts. Nivo’s Storybook offers interactive examples, so you can get a sense of what to build, and their documentation lets you testing out individual components before implementing.
Nivo might be right for you if you need:
ECharts is an open-source Javascript visualization library maintained by the Apache Software Foundation. Companies like Amazon, Gitlab, and Intel use ECharts to include data visualizations in their products, reports, research papers, etc.
We’re working on incorporating ECharts for Metabase data visualizations, so you can say we’re fans of this library, too.
You may want to use ECharts if you need:
Looking for a bundle of open source libraries? With Plotly, you can create interactive charts and maps for Python, R, Julia, and multiple other languages.
You may want to use Plotly if you need:
Visualization libraries are a good option if you’re already deep into component-driven development or have a skilled dev team on hand that can quickly implement and iterate on charts.
However, as you scale, maintaining a visualization library can mean taking on a lot of overhead. For example:
If you outgrow your visualization library in any way, you’ll either need to work with maintainers to add new features or fixes, or pivot to an entirely new visualization library.
Your dev team will need to handle ad-hoc requests for embedding and charting, or you’ll have to find a middle ground, like adding new interfaces and platforms to support teams that aren’t as familiar with a visualization library.
In these scenarios, using a Business Intelligence (BI) tool that has features to support both technical and non-technical teams can save you down the line.
Metabase OSS is a free option if you need a quick solution for embedding. You can create, embed, and iterate on charts at scale, in a matter of minutes. Other BI tools, like Apache Superset or Redash, are also open source and offer similar functionality.
Metabase offers some additional free, out-of-the-box features that can cover the bases for most, if not all of your teams:
To test it out, check out the OSS installation instructions.