


Many analytics stacks technically work. Data flows, models run, dashboards load. The challenge appears when real questions arrive and teams struggle to get clear answers. Westwise was the project that followed that familiar pattern, where the infrastructure existed, but insight remained difficult to access in practice.
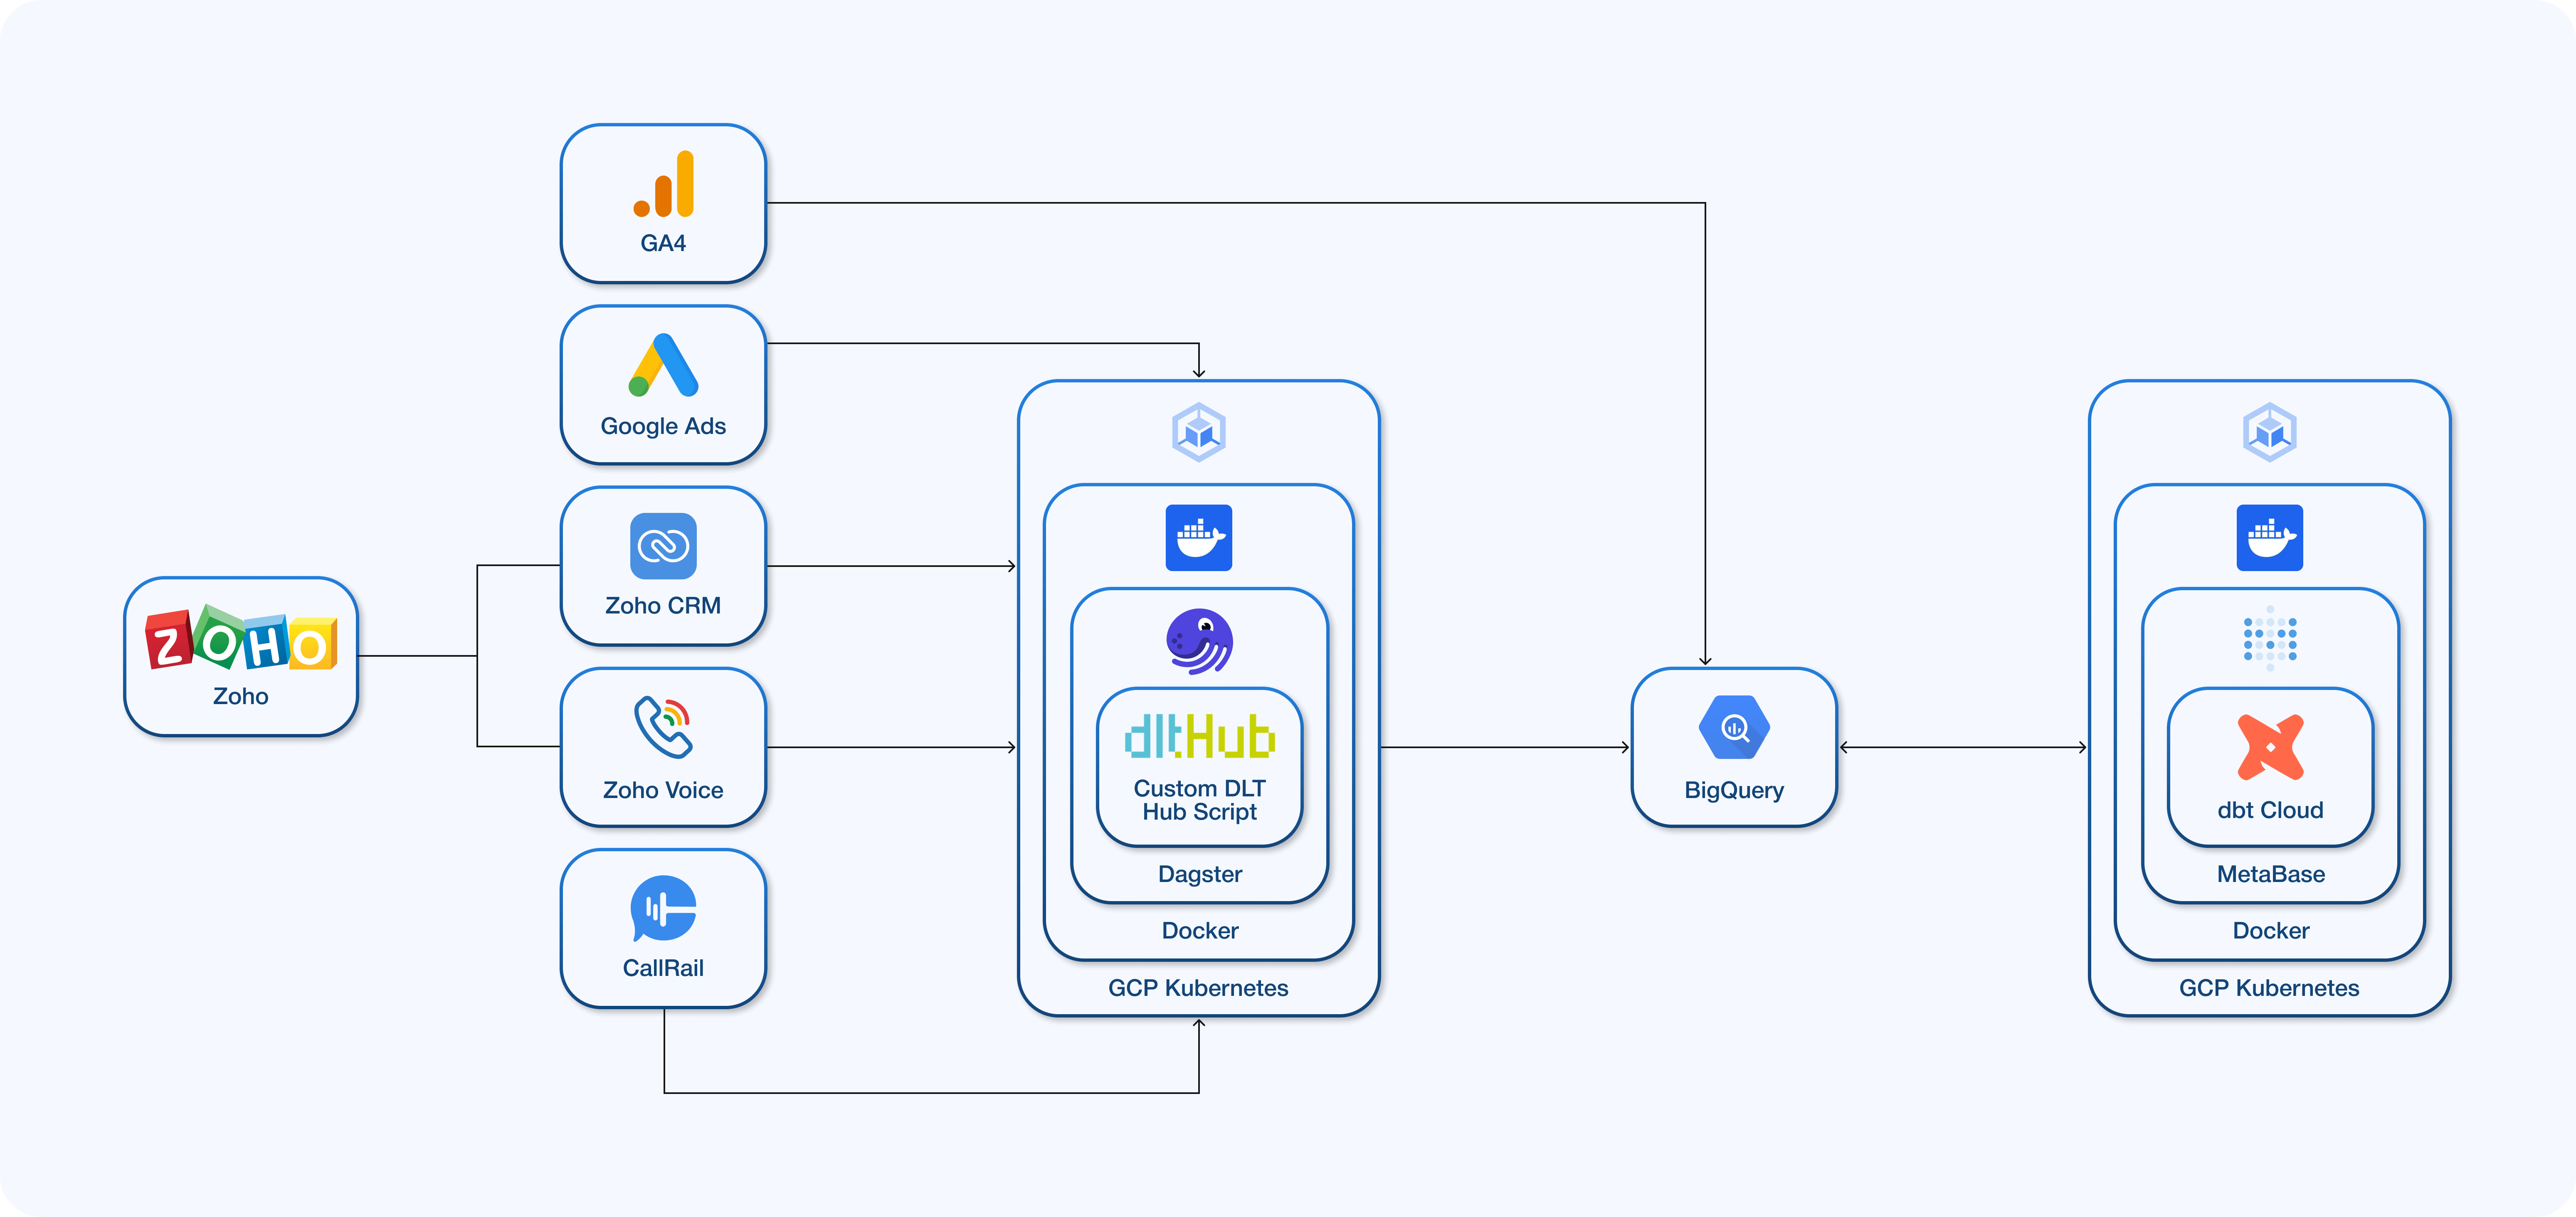
They had data coming from Google Ads, Zoho CRM, Zoho Voice, CallRail and GA4. Everything was already landing in BigQuery and we were using dbt to model it. On paper, the stack looked solid. In reality, teams still struggled to understand performance across marketing, sales and operations.
The missing piece was a flexible analytics layer that could sit on top of clean models and let people explore data without constant back-and-forth.
That is where Metabase proved its value.
Building the analytics foundation: data models first
The real work happened before Metabase.
We first focused on creating clear, weekly business metrics that could be trusted. For example, we built dbt models that aligned Google Ads spend, Westwise operational performance and Affiliate results into a single weekly grain starting on Mondays.
Here is a simplified version of one of the dbt models that powered multiple dashboards:
 {{ config(materialized='table') }} {% endraw *}

WITH ads AS (
  SELECT
    DATE_TRUNC(segments_date, WEEK(MONDAY)) AS segments_week,
    SUM(cost) AS total_cost,
    SUM(clicks) AS total_clicks,
    SUM(impressions) AS total_impressions,
    SUM(cost) / NULLIF(SUM(clicks), 0) AS cpc,
    SUM(clicks) / NULLIF(SUM(impressions), 0) * 100 AS ctr
  FROM {% endraw *}

WITH ads AS (
  SELECT
    DATE_TRUNC(segments_date, WEEK(MONDAY)) AS segments_week,
    SUM(cost) AS total_cost,
    SUM(clicks) AS total_clicks,
    SUM(impressions) AS total_impressions,
    SUM(cost) / NULLIF(SUM(clicks), 0) AS cpc,
    SUM(clicks) / NULLIF(SUM(impressions), 0) * 100 AS ctr
  FROM {% raw %} {{ ref('stg_google_ads__ad_group_report') }}
  GROUP BY segments_week
),
ww_metrics AS (
  SELECT
    DATE_TRUNC(segments_date, WEEK(MONDAY)) AS segments_week,
    SUM(deal_count_ww) AS deal_count_ww,
    SUM(total_calls_ww) AS total_calls_ww,
    SUM(form_submit_ww) AS form_submit_ww,
    SUM(net_revenue_ww) AS net_revenue_ww,
    SUM(gross_profit_ww) AS gross_profit_ww
  FROM  {{ ref('int_ww_daily') }}
  GROUP BY segments_week
),
affiliate_metrics AS (
  SELECT
    DATE_TRUNC(segments_date, WEEK(MONDAY)) AS segments_week,
    SUM(deal_count_affiliate) AS deal_count_affiliate,
    SUM(total_calls_affiliate) AS total_calls_affiliate,
    SUM(form_submit_affiliate) AS form_submit_affiliate,
    SUM(gross_revenue_affiliate) AS gross_revenue_affiliate,
    SUM(gross_profit_affiliate) AS gross_profit_affiliate
  FROM  {{ ref('int_affiliate_daily') }}
  GROUP BY segments_week
)
Once these models were ready, Metabase could do its job properly.
From dbt Models to self-service dashboards with Metabase
With dbt models in place, Metabase connected directly to BigQuery and immediately became useful to non-technical users. We built:
- A KPI dashboard combining Ads and CRM performance
- A Mid-Funnel dashboard using GA4 to track sessions, forms, calls and conversions
- A Sales Agent dashboard with call activity, missed calls and closed deals
- A Month-to-Date dashboard showing revenue, profit, spend and net performance
Drill-downs, filters and time controls worked out of the box. Stakeholders stopped asking for custom queries and started exploring on their own.
Building a pipeline for multi-dimensional call data
Call data was critical to understanding real performance, but it was also the hardest to operationalize. Beyond volume, each record included transcripts, sentiment, and agent-level context. We built an incremental Python pipeline using dlt to ingest and model this data reliably, then exposed it directly in Metabase.
This allowed teams to analyze call activity alongside marketing and CRM metrics in a single interface. Instead of treating calls as raw logs, Metabase turned them into explorable, decision-ready insights through filters, drill-downs, and time-based analysis.
def source_call_rails():
    account_id = os.getenv("CALL_RAILS_ACCOUNT_ID")
    return rest_api_source(
        {
            "client": {
                "base_url": os.getenv("CALL_RAILS_API_BASE_URL"),
                "auth": {
                    "type": "bearer",
                    "token": os.getenv("CALL_RAILS_API_KEY")
                },
                "paginator": PageNumberPaginator(
                    page_param="page",
                    base_page=1,
                    total_path="total_pages"
                )
            },
            "resource_defaults": {
                "write_disposition": "merge",
                "primary_key": "id"
            }
        }
    )
Once modeled in dbt, this data became immediately usable in Metabase.
Conslusion
Metabase did not fix bad data. But once the data was modeled correctly, it made a complex analytics setup feel simple and usable. This project demonstrated that good data models facilitate flexible exploration. Metabase’s built-in filters and drill-downs became even more valuable when backed by reliable, well-modeled data. That is why it became the right tool at the right time.