




What is email open rate, and how do you measure it in Metabase?
Email open rate is unique opens divided by delivered emails — the classic first read on whether a subject line and sender name earned attention. Classic, and increasingly compromised: privacy proxies now open email no human read. Measure it in Metabase from campaign stats synced from Klaviyo, Mailchimp, or ActiveCampaign — and read it next to click-through rate, which still measures people.
unique opens ÷ delivered, per campaign
and month, treated as a directional signal rather than a truth. Apple Mail
Privacy Protection has inflated opens with machine pre-fetches since 2021,
so decisions belong with clicks and conversions; opens are for spotting
relative movement within your own list.
What does an open rate chart look like in Metabase?
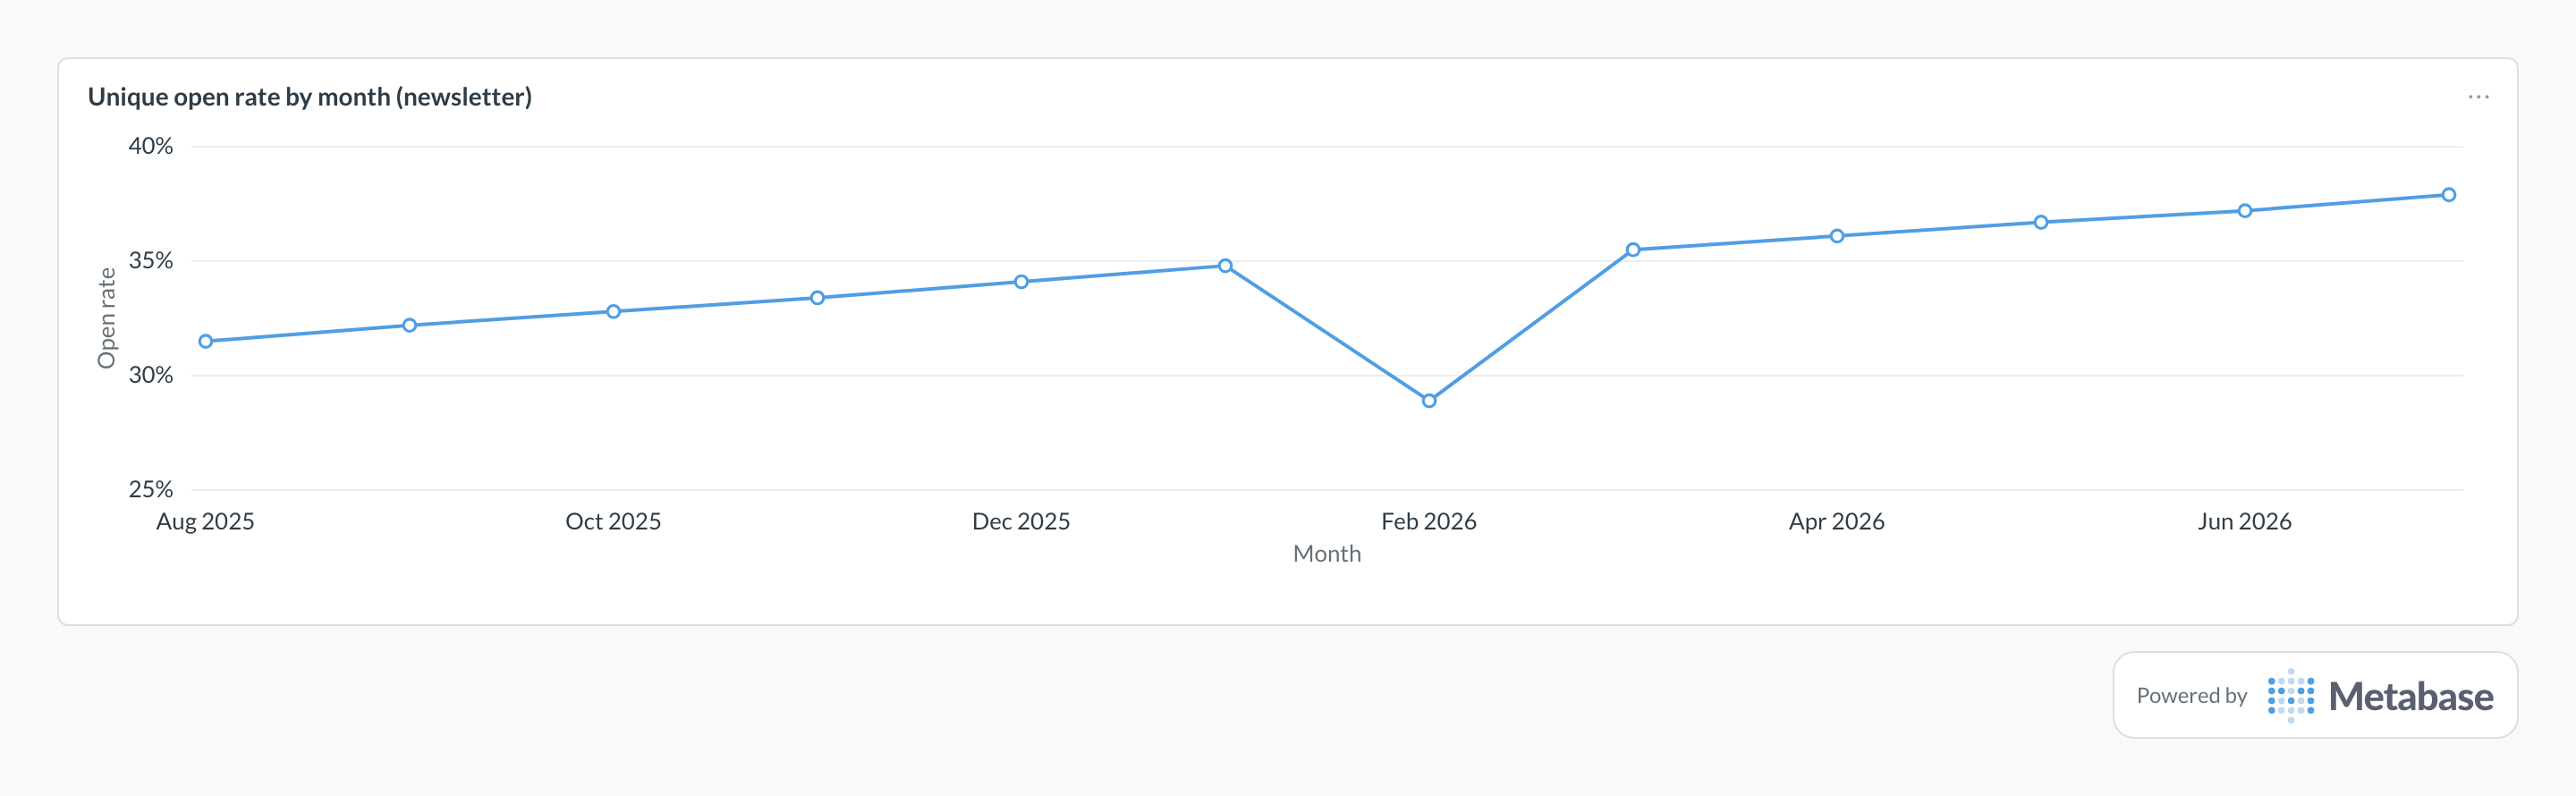
Chart unique opens over delivered per month for one campaign type as a line, reading the trend rather than the level — machine opens inflate the absolute number. The gradual climb reflects subject-line and list-hygiene work compounding, while a one-month dip like February's usually signals a deliverability wobble, worth checking against bounce rate before rewriting subject lines.
What open rate measures
Mechanically, it measures tracking-pixel loads: an invisible image fires when the email renders, and the sender's platform logs an open. That made it a decent attention proxy for two decades — subject line tests, send-time tests, and list-health checks all ran on it. It still works for relative comparisons inside one list on one day, and a collapse in opens remains a useful deliverability alarm (inbox vs. spam folder placement). What it no longer supports is absolute claims: "42% of recipients read this" hasn't been a defensible sentence since the proxies arrived.
The Apple Mail Privacy Protection problem
Since late 2021, Apple's Mail Privacy Protection routes mail for opted-in Apple Mail users through Apple's servers, which pre-fetch every image — including the tracking pixel — whether or not the recipient ever opens the message. Each pre-fetch registers as an open. Other privacy tools and corporate security scanners do the same on a smaller scale. The practical consequences: open rates stepped up in 2021 and never came back down, open-based segments like "hasn't opened in 90 days" misclassify Apple Mail users as engaged, and open-rate A/B test wins can be pure noise. Where the platform exposes it, split machine opens from human opens; where it doesn't, weight clicks instead.
What data does it need?
-
An
email_campaign_statstable withsent_at,campaign_name,campaign_type,delivered,unique_opens, andunique_clicks— the standard shape of campaign-level syncs from email platforms. -
deliveredas the denominator, notsent— bounces belong to email bounce rate. - Optional but valuable: list-age or segment fields, and the platform's machine-open flag where one exists.
SQL patterns
SELECT
  date_trunc('month', sent_at) AS month,
  campaign_name,
  SUM(delivered) AS delivered,
  SUM(unique_opens) AS unique_opens,
  ROUND(
    100.0 * SUM(unique_opens) / NULLIF(SUM(delivered), 0), 1
  ) AS open_rate_pct
FROM email_campaign_stats
WHERE sent_at >= CURRENT_DATE - INTERVAL '12 months'
GROUP BY 1, 2
ORDER BY 1, 2;SELECT
campaign_type,
SUM(delivered) AS delivered,
ROUND(
100.0 * SUM(unique_opens) / NULLIF(SUM(delivered), 0), 1
) AS open_rate_pct,
ROUND(
100.0 * SUM(unique_clicks) / NULLIF(SUM(delivered), 0), 2
) AS click_rate_pct,
ROUND(
100.0 * SUM(unique_clicks) / NULLIF(SUM(unique_opens), 0), 1
) AS click_to_open_pct
FROM email_campaign_stats
WHERE sent_at >= CURRENT_DATE - INTERVAL '90 days'
GROUP BY 1
ORDER BY open_rate_pct DESC;Pitfalls
Where this metric applies
- Klaviyo + Metabase — campaign and flow stats for e-commerce email
- Mailchimp + Metabase — campaign reports with unique opens and clicks
- ActiveCampaign + Metabase — campaign and automation engagement stats
- HubSpot + Metabase — marketing email stats joined to CRM outcomes
Related
Metrics
Dashboards
FAQ
Why did our open rates jump without any change in engagement?
Unique opens or total opens?
unique_opens ÷ delivered.