




What does a feature flag rollout dashboard show in Metabase?
A feature flag rollout dashboard shows rollout activity and flag hygiene: what's changing, what's mid-rollout, and which temporary flags became permanent by neglect. It's built from flag and audit-log data synced from LaunchDarkly or Statsig.
For: platform teams and release owners. Grain: one row per flag change event, plus the flag definitions themselves.
What does a feature flag rollout dashboard look like?
Here’s the layout this guide builds: the current rollout and flag counts at the top, then exposure over time and how flags move through environments, then the flag debt and the changes that landed next to an error spike. Read it before a rollout step-up and during incident triage.
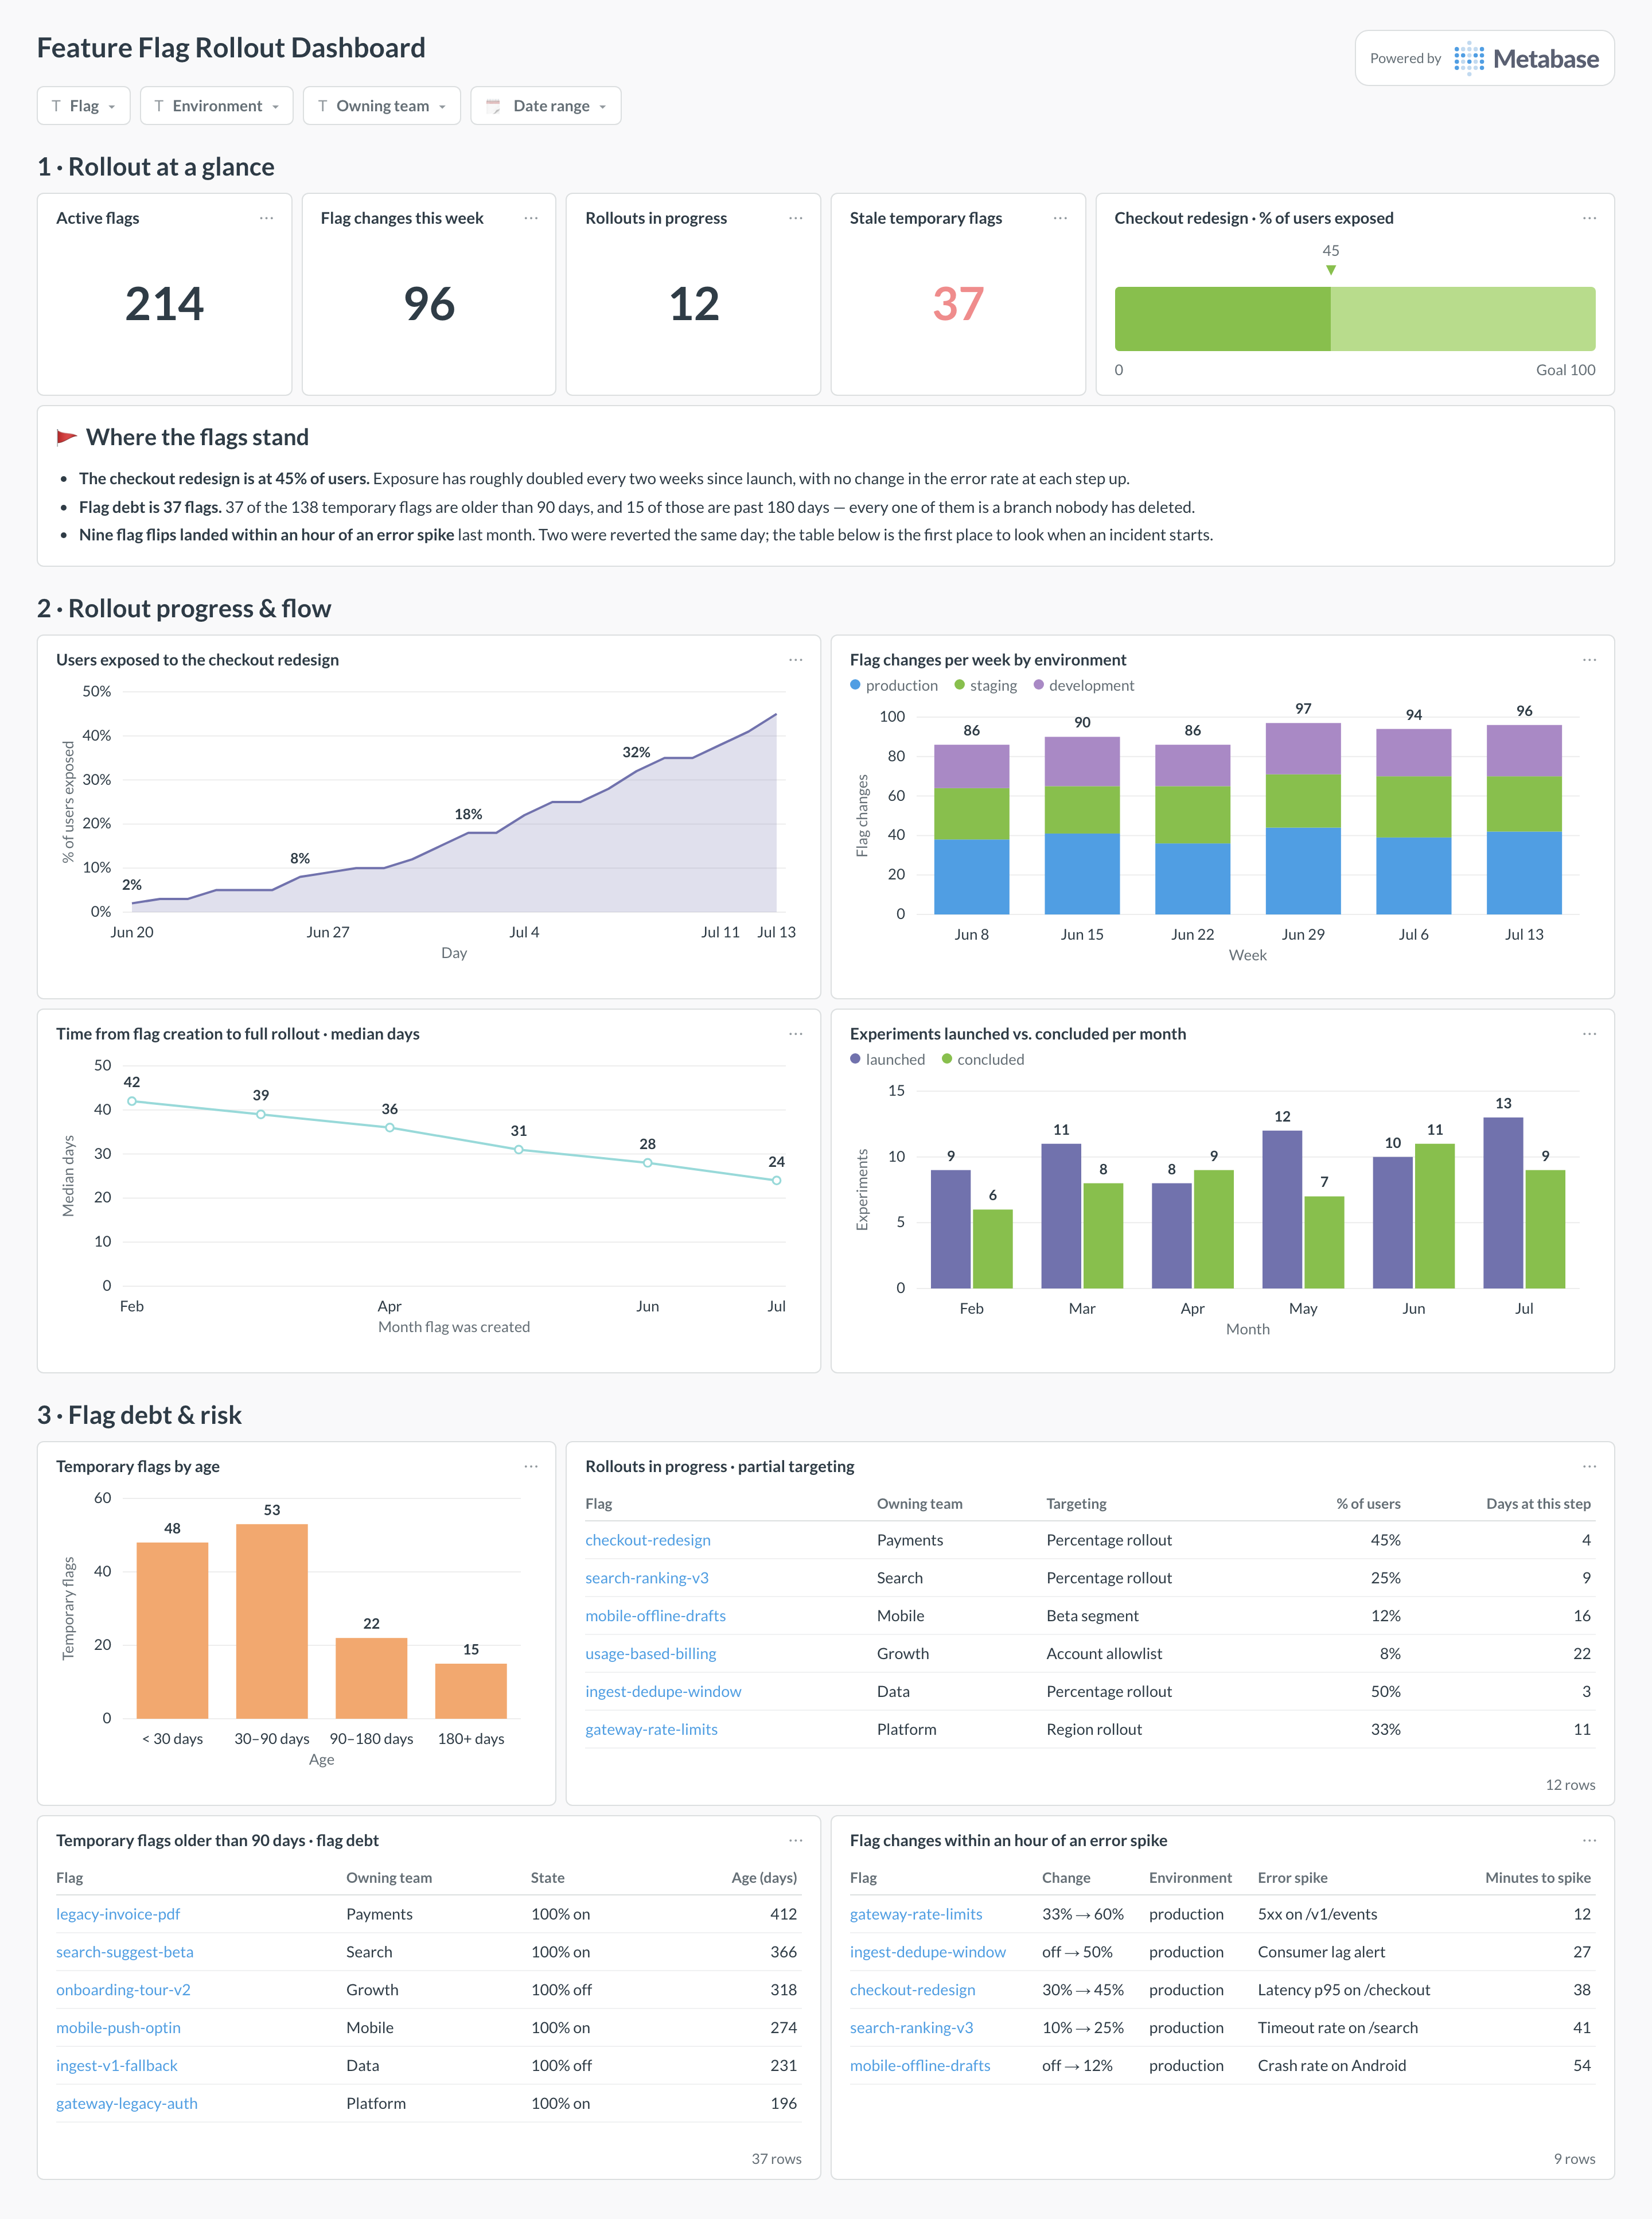
An example feature flag rollout dashboard in Metabase, built from LaunchDarkly or Statsig flag data. Figures are illustrative.
Which cards belong on a feature flag rollout dashboard?
- Flag changes per week by environment (stacked bar)
- Rollouts in progress — partial targeting, by flag (table)
- Time from flag creation to full rollout, median by month (line)
- Temporary flags older than 90 days — flag debt (table)
- Flag changes near incidents or error spikes (table)
- Experiments launched vs. concluded per month (bar)
What data does the dashboard need?
flags— key, project,temporary,archived, andcreated_at.flag_changes— the audit log at event grain: flag key, environment, action, actor, andchanged_at. This table is the analytics backbone; current flag state alone can’t answer trend questions.- Optional
experimentswith start and conclusion dates, if your platform runs experiments on flags. - Synced from LaunchDarkly (via Fivetran or Airbyte) or Statsig into a database or warehouse.
How do you build it?
- Sync flag definitions and the audit log into a database — Metabase reads databases and warehouses, not flag platforms directly.
- Group micro-toggles into meaningful changes: collapse events on the same flag and environment within a short window, or rollout ramps dominate every trend.
- Build the changes-by-environment trend and the stale-flag table first — activity and hygiene are the two halves of the story.
- Join changes to incident data from PagerDuty or Sentry by service and time window for the change-safety card.
Example card SQL
SELECT
DATE_TRUNC('week', changed_at) AS week,
environment,
COUNT(*) AS flag_changes
FROM flag_changes
WHERE changed_at >= CURRENT_DATE - INTERVAL '12 weeks'
AND action IN (
  'targeting_on', 'targeting_off', 'rules_updated', 'rollout_updated'
)
GROUP BY 1, 2
ORDER BY 1, 2;SELECT
f.key,
f.project,
f.created_at,
MAX(c.changed_at) AS last_changed_at
FROM flags f
LEFT JOIN flag_changes c ON c.flag_key = f.key
WHERE f.temporary
AND NOT f.archived
AND f.created_at < CURRENT_DATE - INTERVAL '90 days'
GROUP BY f.key, f.project, f.created_at
ORDER BY f.created_at
LIMIT 50;Related
Metrics
Integrations
Dashboards
FAQ
What is a feature flag rollout dashboard?
What data sources feed a feature flag rollout dashboard?
flags and flag_changes tables first, then point Metabase at them.Why build on the audit log instead of current flag state?
How do you catch stale feature flags?
temporary; the stale-flag card lists temporary, unarchived flags older than 90 days — each one a code path someone must still reason about and a rollback lever nobody remembers. The example SQL on this page produces exactly that list; review it in sprint planning and archive or remove a few flags each cycle rather than letting the list compound.How do flag changes relate to incidents?
flag_changes to incident data from PagerDuty or error spikes from Sentry by service and time window to see which changes preceded trouble — the same change-safety logic behind change failure rate, and a natural companion to the release quality dashboard.