




What is bug count, and how do you measure it in Metabase?
Bug count is the number of open defects — but the raw total is the least useful form of it. The versions worth charting are net new bugs (opened minus closed), the severity mix, and how long open bugs have been sitting. Measure them in Metabase from issue data synced from Jira, Linear, GitHub, or GitLab.
opened − closed per month by severity, plus age buckets of what stays open. The trend and the
mix carry the signal; the absolute number mostly measures how diligently people
file tickets.
What does a bug count chart look like in Metabase?
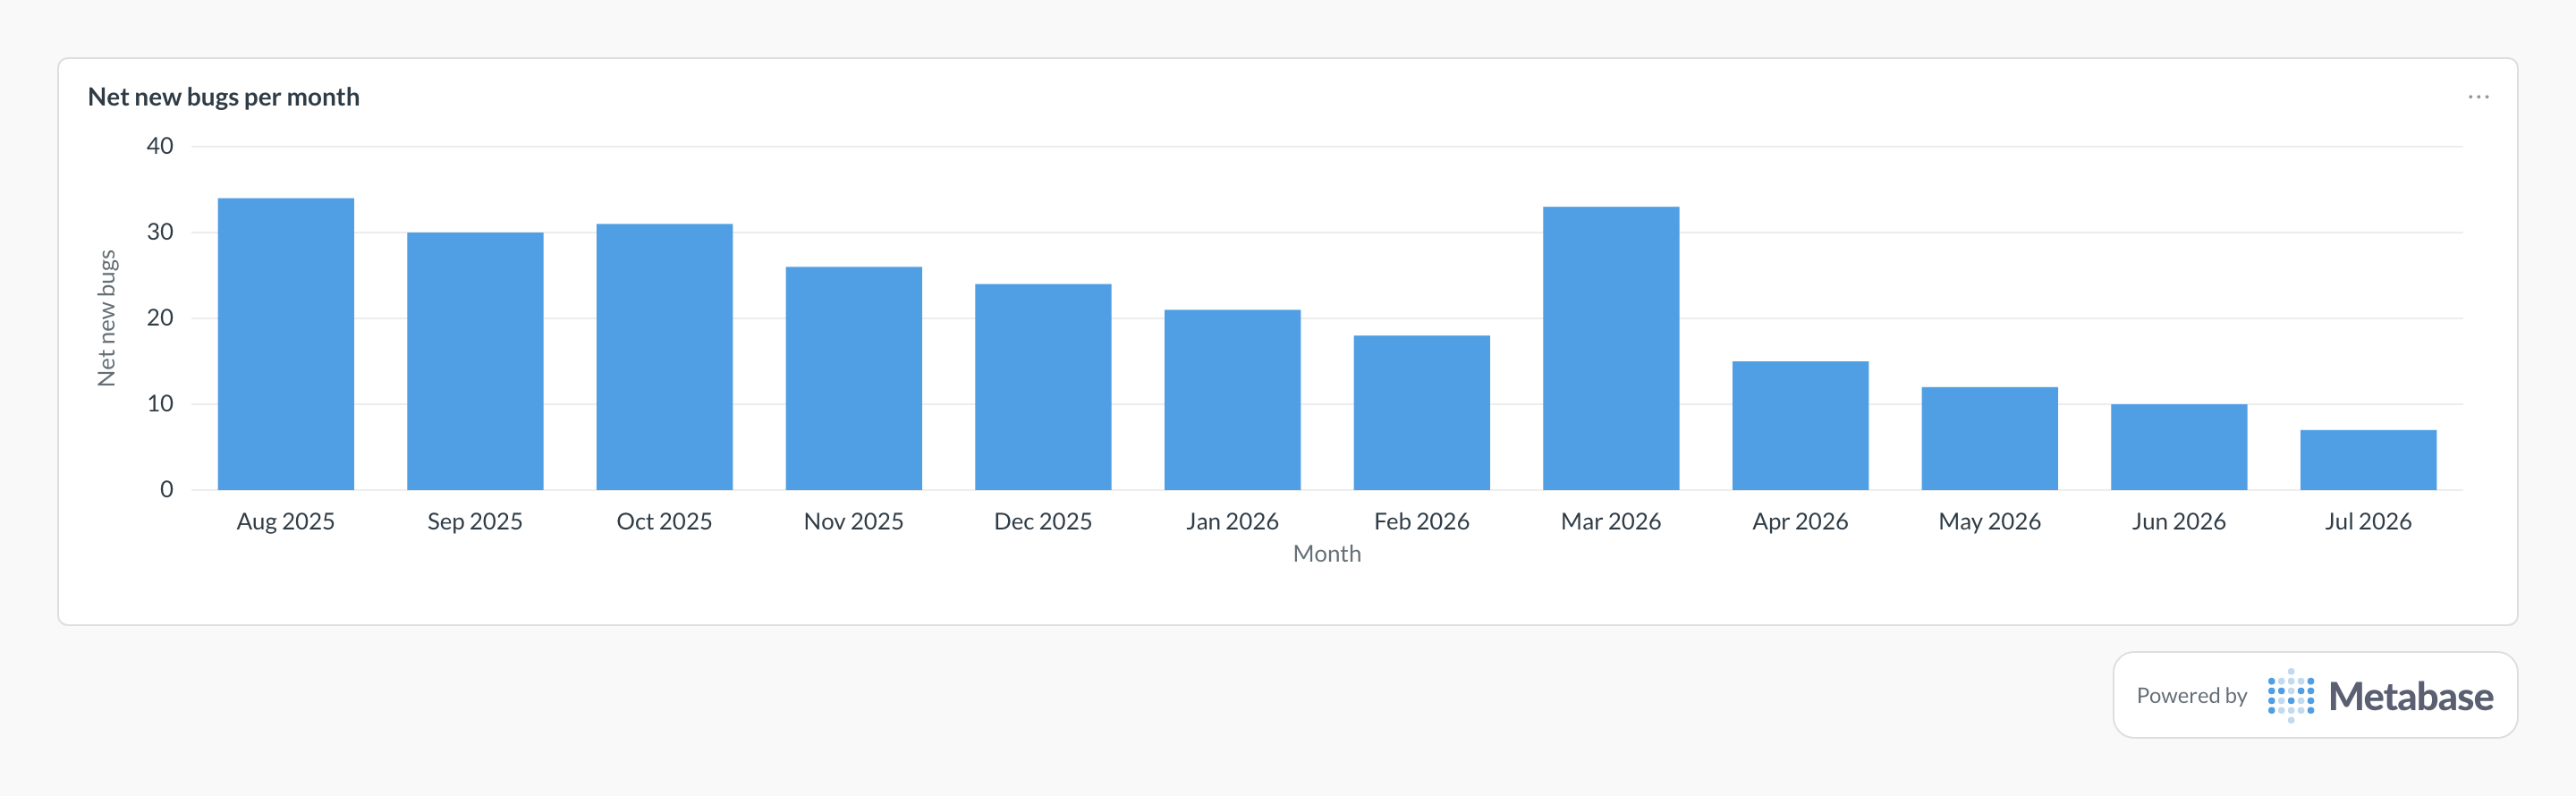
Chart net new bugs — opened minus closed — per month as bars, and read the shrinking bars as the backlog paydown outpacing new defects. A one-month jump like March's usually lands right after a major release or a triage sweep that filed everything at once, which is worth an annotation rather than a quality panic.
What bug count measures
At its best, it measures defect flow: whether quality work is keeping pace with defect discovery, and where unfixed bugs accumulate. That takes three cuts. Net new by severity shows the direction of travel. Age buckets show whether the backlog is churning or rotting. And the escaped-vs-caught-in-dev split shows whether bugs are being found by your tests or by your users — the same leak change failure rate measures per deploy, seen per defect. Raw totals normalize none of this, which is why two teams with identical quality can report totals an order of magnitude apart.
What data does it need?
-
An
issuestable:issue_type,severity,component,opened_at,closed_at,status. - A detection-source tag per bug — production report, QA, automated test, code review — for the escaped share.
- A consistent definition of "bug" across trackers: severity scales and issue types differ between Jira and Linear, so normalize in the model.
- Source: Jira, Linear, GitHub, or GitLab issues synced via Airbyte or Fivetran into the warehouse.
SQL patterns
WITH monthly AS (
  SELECT
    date_trunc('month', opened_at) AS month,
    severity,
    COUNT(*) AS opened,
    0 AS closed
  FROM issues
  WHERE issue_type = 'bug'
  GROUP BY 1, 2
  UNION ALL
  SELECT
    date_trunc('month', closed_at),
    severity,
    0,
    COUNT(*)
  FROM issues
  WHERE issue_type = 'bug'
    AND closed_at IS NOT NULL
  GROUP BY 1, 2
)
SELECT
  month,
  severity,
  SUM(opened) AS opened,
  SUM(closed) AS closed,
  SUM(opened) - SUM(closed) AS net_new
FROM monthly
GROUP BY 1, 2
ORDER BY 1, 2;SELECT
component,
COUNT(*) FILTER (WHERE age_days <= 7) AS "0_7d",
COUNT(*) FILTER (WHERE age_days BETWEEN 8 AND 30) AS "8_30d",
COUNT(*) FILTER (WHERE age_days BETWEEN 31 AND 90) AS "31_90d",
COUNT(*) FILTER (WHERE age_days > 90) AS "90d_plus"
FROM (
SELECT
component,
EXTRACT(EPOCH FROM (CURRENT_TIMESTAMP - opened_at)) / 86400
AS age_days
FROM issues
WHERE issue_type = 'bug'
AND status NOT IN ('done', 'closed', 'wont_fix')
) open_bugs
GROUP BY component
ORDER BY "90d_plus" DESC;Pitfalls
Where this metric applies
- Jira + Metabase — bugs with severity, component, and lifecycle timestamps
- Linear + Metabase — issues with labels and cycle context
- GitHub + Metabase — bug-labeled issues joined to releases
- GitLab + Metabase — issues alongside pipelines and deploys
Related
Metrics
Dashboards
FAQ
Why is the total open bug count a bad headline number?
What does net new bug count tell you?
opened − closed per month, by severity. Positive net-new in high severities for consecutive months means quality work is underwater regardless of what the total says; negative net-new during a cleanup sprint proves the paydown is real. It also absorbs backlog-hygiene noise — a mass-closure of stale tickets shows up as one obvious spike in closed rather than silently flattering the total for a quarter.How should bug age be read?
What are escaped bugs, and why track them separately?
How do you track bug count in Metabase?
issues table: issue_type, severity, component, opened_at, closed_at, status, and a detection-source tag. Chart net new by month and severity, age buckets by component, and the escaped share — and pin them with the rest of your software delivery analytics so bug flow sits next to cycle time and deploys.