





What is deal slippage rate, and how do you measure it in Metabase?
Deal slippage rate is the share of deals expected to close in a period whose close date slips out of it — by count, or value-weighted as slipped pipeline ÷ committed pipeline. It's the difference between a forecast that's wrong and a forecast that's late, and it's invisible in a live CRM view because the new close date overwrites the old one. Measure it in Metabase from close-date history synced from Salesforce, HubSpot, or Pipedrive.
What does a deal slippage rate chart look like in Metabase?
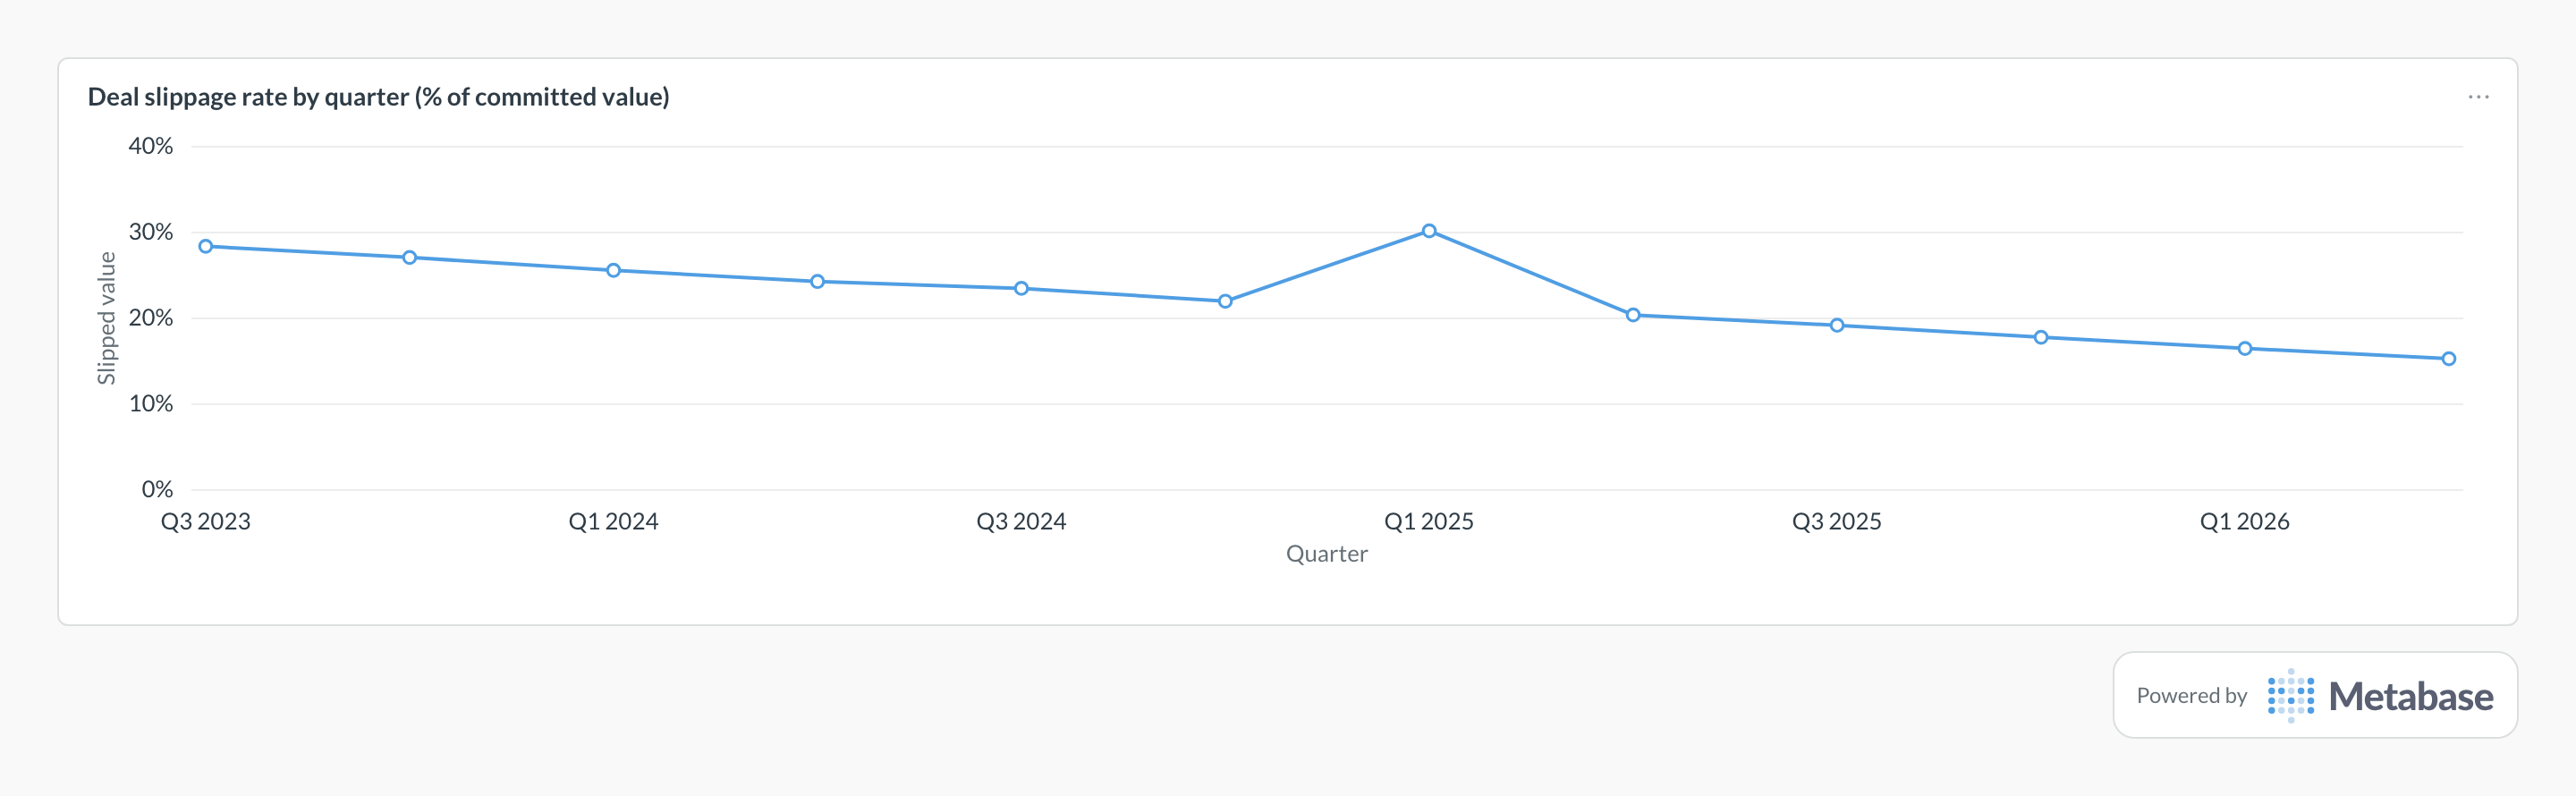
Chart slipped value as a share of each quarter's committed pipeline and watch the level, not the wiggle: the fall from about 28% to 15% is commit discipline improving snapshot by snapshot. A one-quarter spike like Q1 2025's is usually a single mega-deal moving out — the value rate jumps while the slipped-deal count barely moves, which is why both are worth a card.
What deal slippage rate measures
It measures how much of the committed period actually holds. Every quarter-end miss decomposes into deals lost, deals shrunk, and deals that simply moved — slippage isolates the third bucket, the one reps describe as "still on, just pushed." A persistently high slippage rate means close dates are aspirations rather than commitments, which quietly corrupts forecast accuracy, pipeline coverage, and every other metric that trusts the close-date field.
At deal grain, the same history yields a second signal: repeat slippage. A deal that has pushed twice is statistically closer to lost than late — it drags out sales cycle length and pads the pipeline while it decays. Ranking open deals by times slipped is one of the cheapest deal-health checks a revenue team can run.
What data does it need?
- Close-date history, from one of two sources: CRM
field-history tables (Salesforce's
OpportunityFieldHistory, HubSpot property history) synced along with the deals, or a scheduled snapshot job that writes open deals — id, amount, stage, close date — to adeal_snapshotstable daily or weekly. - A snapshot at the commitment point (start of quarter or month) defining which deals were expected to close in the period.
-
Current deal state —
is_closed,is_won, currentclose_date— to classify each committed deal as closed, slipped, or lost. - The caveat that decides everything: a fresh warehouse sync only captures history from the day it starts. If you haven't been snapshotting, you cannot compute last quarter's slippage retroactively — begin now and the metric becomes available one period later.
SQL patterns
-- Deals in the start-of-quarter forecast that moved out of the quarter
WITH committed AS (
  SELECT deal_id, amount
  FROM deal_snapshots
  WHERE snapshot_date = date_trunc('quarter', CURRENT_DATE)
    AND NOT is_closed
    AND close_date >= date_trunc('quarter', CURRENT_DATE)
    AND close_date <  date_trunc('quarter', CURRENT_DATE)
                      + INTERVAL '3 months'
)
SELECT
  COUNT(*) AS committed_deals,
  COUNT(*) FILTER (
    WHERE NOT d.is_closed
      AND d.close_date >= date_trunc('quarter', CURRENT_DATE)
                          + INTERVAL '3 months'
  ) AS slipped_deals,
  ROUND(
    100.0 * SUM(c.amount) FILTER (
      WHERE NOT d.is_closed
        AND d.close_date >= date_trunc('quarter', CURRENT_DATE)
                            + INTERVAL '3 months'
    ) / NULLIF(SUM(c.amount), 0), 1
  ) AS slipped_value_pct
FROM committed c
JOIN modeled_deals d ON d.deal_id = c.deal_id;-- Open deals ranked by how many times the close date moved later
WITH moves AS (
SELECT
deal_id,
close_date,
LAG(close_date) OVER (
PARTITION BY deal_id ORDER BY snapshot_date
) AS prev_close_date
FROM deal_snapshots
)
SELECT
d.deal_name,
d.owner,
d.amount,
COUNT(*) AS times_slipped
FROM moves m
JOIN modeled_deals d ON d.deal_id = m.deal_id
WHERE m.close_date > m.prev_close_date
AND NOT d.is_closed
GROUP BY 1, 2, 3
HAVING COUNT(*) >= 2
ORDER BY times_slipped DESC, d.amount DESC
LIMIT 20;Pitfalls
Where this metric applies
- Salesforce + Metabase —
OpportunityFieldHistoryfor close-date changes - HubSpot + Metabase — deal property history for close-date moves
- Pipedrive + Metabase — deal change logs and expected close dates
- Attio + Metabase — deal records snapshotted on a schedule in the warehouse
Related
Metrics
Analytics
Dashboards
FAQ
Should I count slipped deals or slipped value?
Why can't I compute slippage from my CRM data as it is today?
OpportunityFieldHistory) or scheduled snapshots of the pipeline written to your warehouse. A fresh sync via Airbyte or Fivetran starts capturing history from day one — it cannot reconstruct the past. The same constraint applies to forecast accuracy, so one snapshot table usually serves both.