





What is deal profitability, and how do you measure it in Metabase?
Deal profitability is the margin a deal actually earns: revenue net of discounts, minus the cost to deliver and serve it — implementation hours, support load, infrastructure, commissions. Revenue targets reward closing anything; this metric shows which wins were worth winning. Measure it in Metabase by joining CRM data from HubSpot or Salesforce with cost data from QuickBooks or NetSuite in one warehouse.
net revenue − cost to deliver, computed per won deal and segmented by product, segment, and rep. It
needs CRM and finance data joined on a deal or account key — neither system
has both halves. Watch discount depth as the leading indicator.
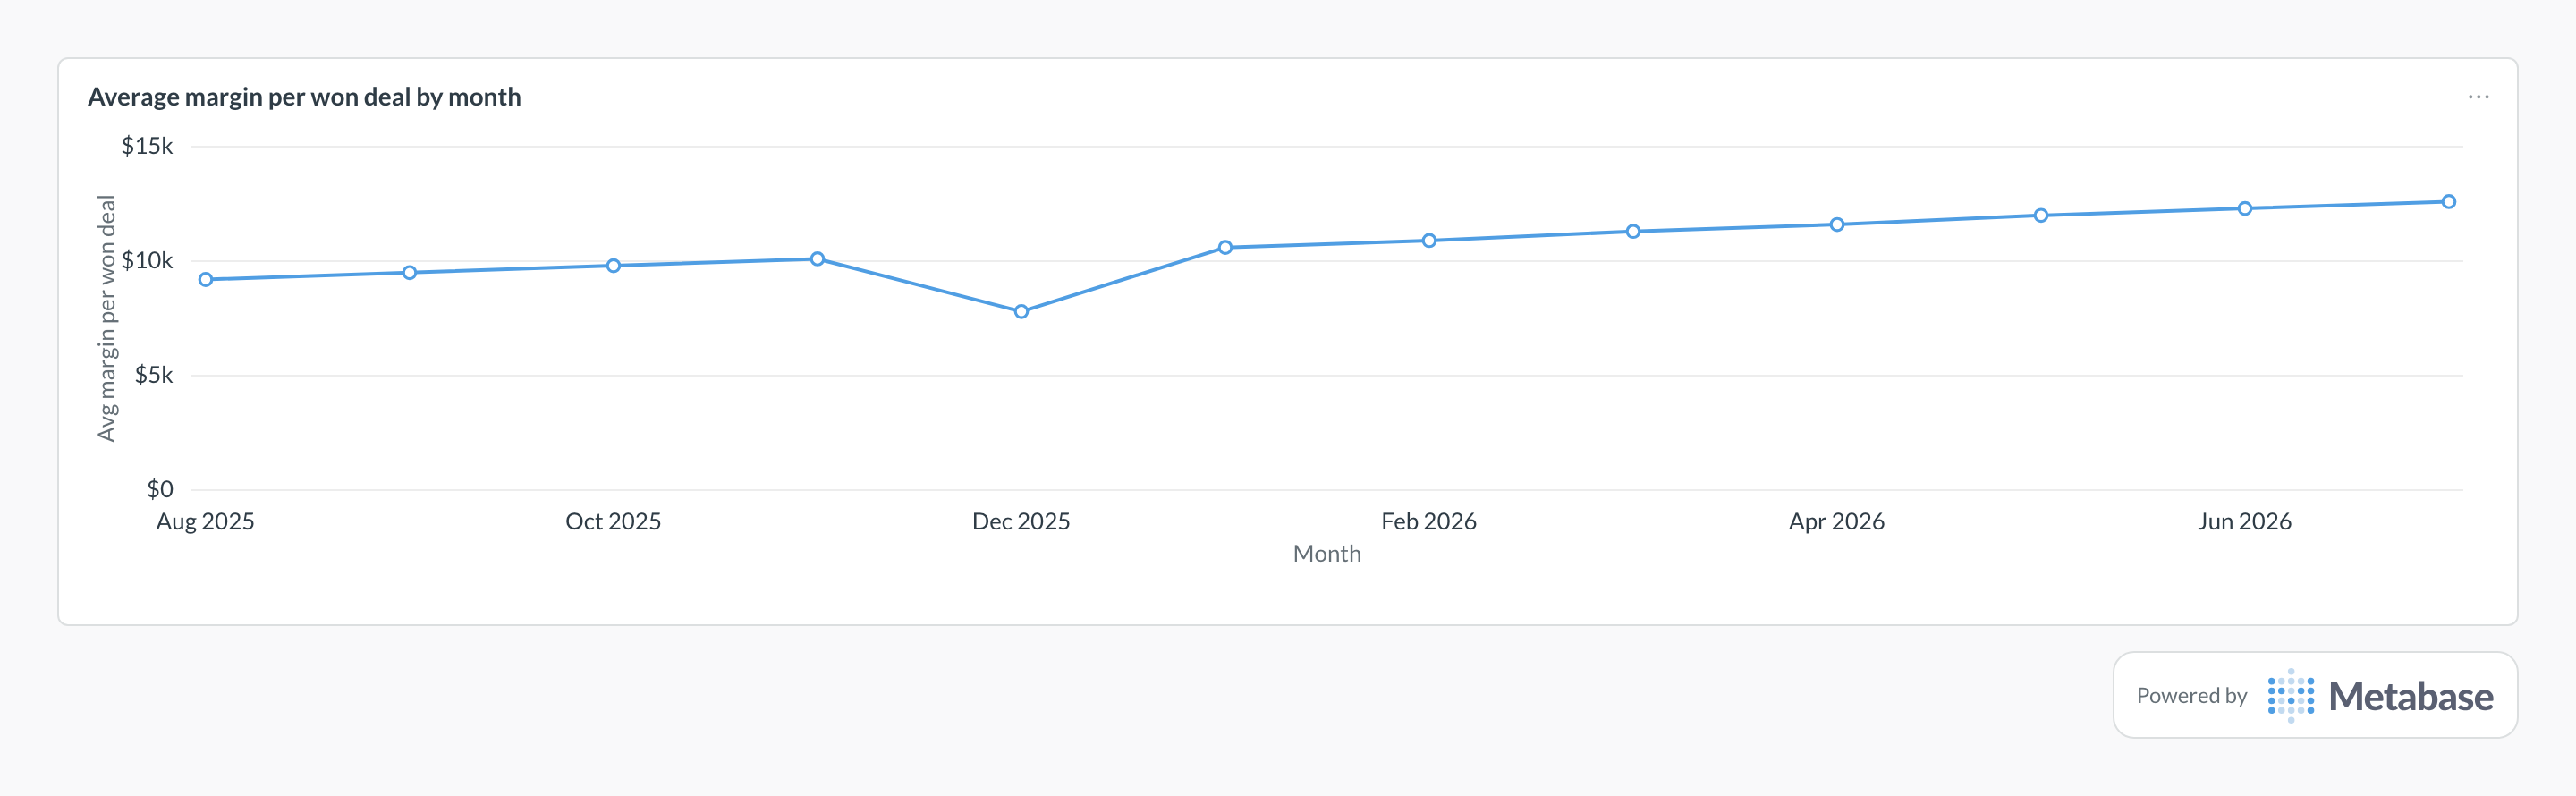
What does a deal profitability chart look like in Metabase?
Chart average margin per won deal by month and watch the level and the slope together. The steady climb says pricing discipline is holding as deal volume grows, while a dip like Dec 2025's is the classic quarter-end signature — deeper discounts buying year-end closes at the expense of margin.
What deal profitability measures
It measures whether a deal made money, not just whether it closed. A team can hit its revenue number while margin quietly erodes: discounts deepen to force quarter-end closes, implementation-heavy deals eat their first-year revenue in services, and small accounts generate outsized support load. None of that shows up in bookings, win rate, or average deal size — the three numbers most sales dashboards stop at.
Segmented by product, customer segment, and rep, margin per deal turns pricing debates into data: which discounts pay for themselves, which segments cost more to serve than they return, and whose pipeline is actually profitable. Over a customer's lifetime the same logic rolls up into LTV; at company level it rolls up into gross margin.
What data does it need?
- Deal records from the CRM: amount, list price or discount
percentage, product, segment, owner, and
closed_at— synced from HubSpot, Salesforce, Pipedrive, or Attio via a pipeline like Airbyte or Fivetran. - Cost records from finance or PSA systems: commissions, implementation time at a loaded rate, support effort, and attributable infrastructure — from QuickBooks, Xero, or NetSuite.
- A join key connecting the two: a deal or account identifier carried on invoices, time entries, and commission records. Modeling this mapping is usually the real work.
-
A modeled
deal_coststable that sums cost lines per deal, so the margin query stays a simple join.
SQL patterns
SELECT
  date_trunc('month', d.closed_at) AS month,
  COUNT(*) AS won_deals,
  ROUND(
    SUM(d.amount - COALESCE(c.total_cost, 0)) / COUNT(*), 0
  ) AS avg_margin_per_deal,
  ROUND(
    100.0 * SUM(d.amount - COALESCE(c.total_cost, 0))
      / NULLIF(SUM(d.amount), 0), 1
  ) AS margin_pct
FROM modeled_deals d
LEFT JOIN deal_costs c ON c.deal_id = d.deal_id
WHERE d.is_won
  AND d.closed_at >= CURRENT_DATE - INTERVAL '12 months'
GROUP BY 1
ORDER BY 1;SELECT
segment,
CASE
WHEN discount_pct < 10 THEN '00-10%'
WHEN discount_pct < 20 THEN '10-20%'
WHEN discount_pct < 30 THEN '20-30%'
ELSE '30%+'
END AS discount_band,
COUNT(*) FILTER (WHERE is_won) AS won,
COUNT(*) FILTER (WHERE is_closed) AS closed,
ROUND(
100.0 * COUNT(*) FILTER (WHERE is_won)
/ NULLIF(COUNT(*) FILTER (WHERE is_closed), 0), 1
) AS win_rate_pct
FROM modeled_deals
WHERE is_closed
GROUP BY 1, 2
ORDER BY 1, 2;Pitfalls
Where this metric applies
- HubSpot + Metabase — deal amounts, discounts, and line items
- Salesforce + Metabase — opportunity amounts and product splits
- QuickBooks + Metabase — invoices and cost lines to set against deals
- NetSuite + Metabase — revenue and cost detail for larger finance stacks
Related
Metrics
Analytics
Dashboards
FAQ
How is deal profitability different from gross margin?
What costs should count against a deal?
Where does the cost data come from?
Why track discount depth if I already track margin?
How do you track deal profitability in Metabase?
deal_costs table keyed by deal, and chart margin per won deal by month, segment, and rep. Pin it next to average deal size on your sales pipeline dashboard so deal count, size, and margin get read together.