What is LLM cache hit rate, and how do you track it in Metabase?
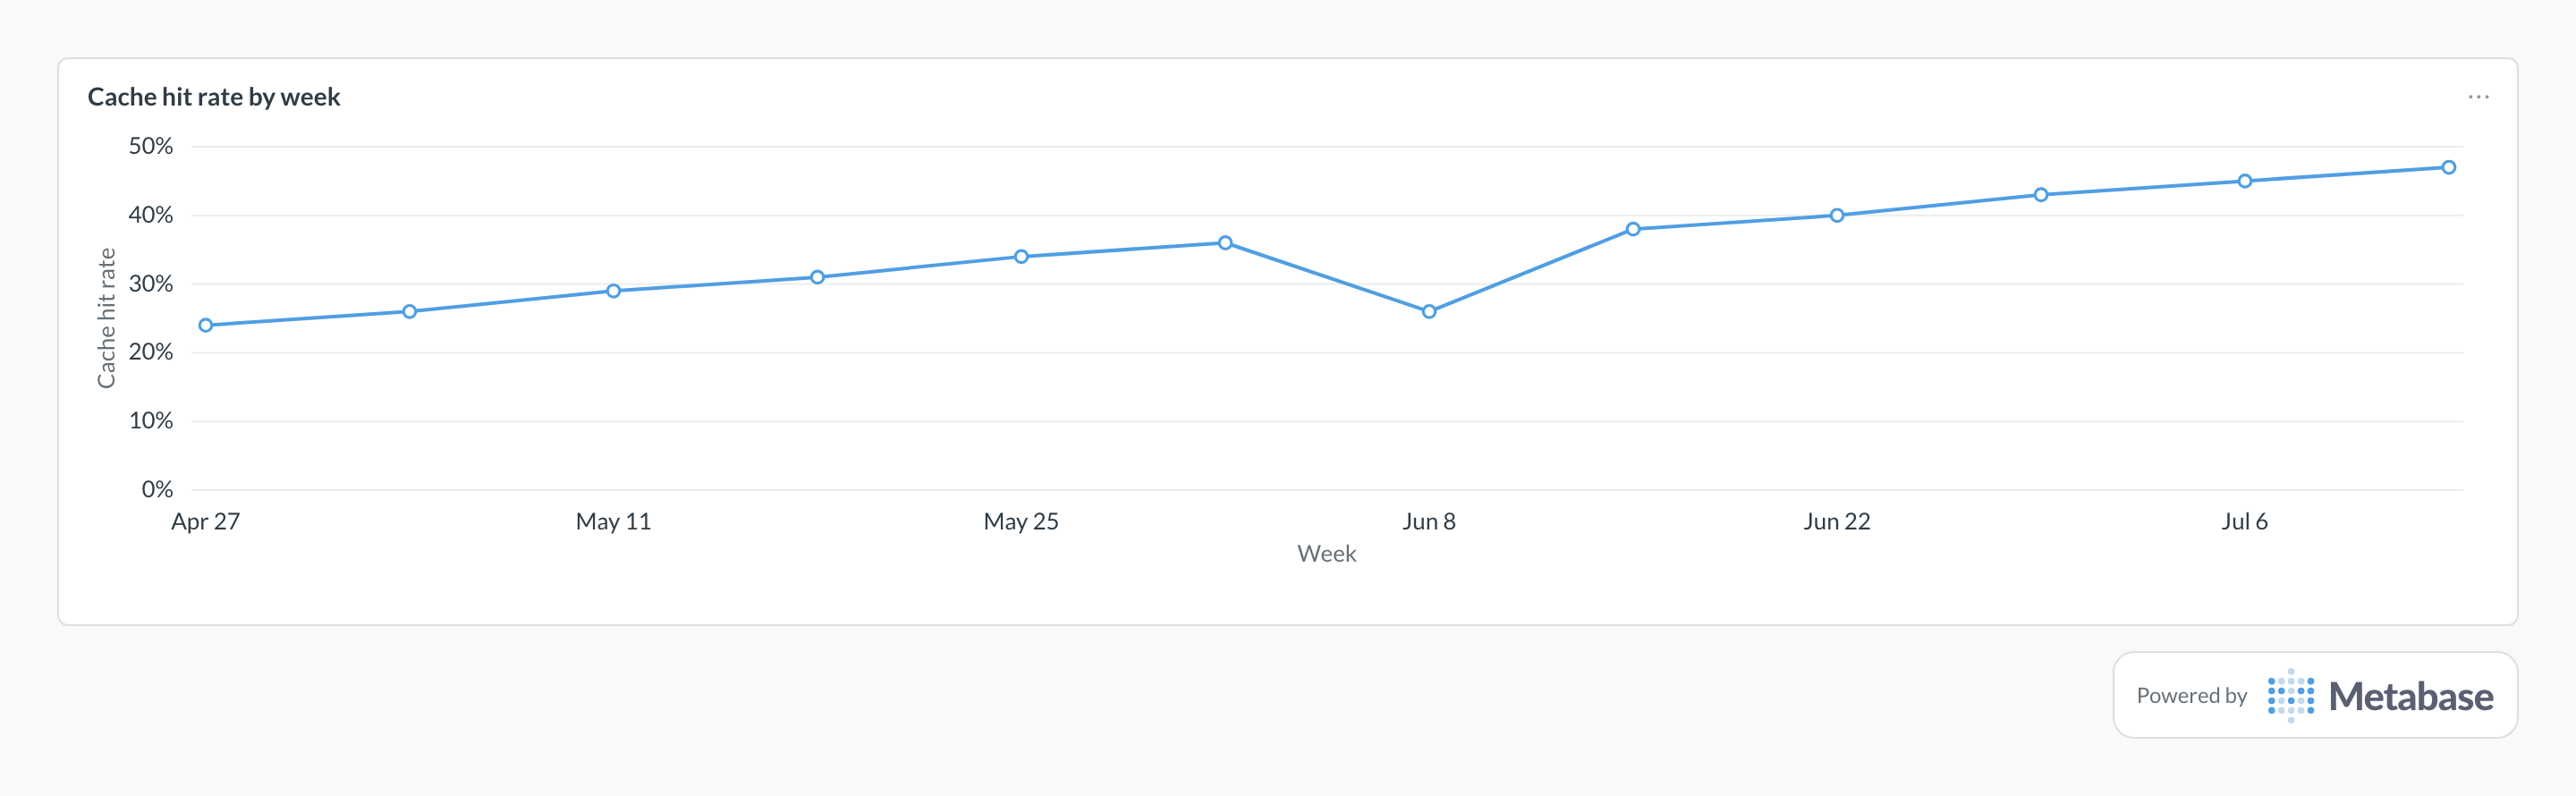
What does a cache hit rate chart look like in Metabase?
Chart hits as a share of requests per week: the climb from the mid-20s toward 50% is caching maturing — stabler prompt prefixes and more repeated questions served without a fresh model call. A sharp dip like Jun 8's usually follows a prompt-template deploy that broke prefix stability, and catching it here beats finding it on the invoice.
Cache hit rate as a Metabase card, built from synced LLM
analytics data. Figures are illustrative.
Definition
LLM cache hit rate is the share of requests (or tokens) served from a cache instead of a fresh model call — spanning gateway response caches, semantic caches, and provider-side prompt caching. It's a direct cost and latency lever: cached responses are near-free and instant, and cached prompt tokens are billed at a steep discount.
Formula: cache_hits ÷ requests per window (response caching) — or cached_tokens ÷ prompt_tokens (provider prompt caching), tracked separately
What data do you need?
Cache hit flags or counts per request from the gateway or proxy
Cached-token fields where providers report prompt-cache reads
Cost fields so savings can be estimated at real rates, not list rates
App tags — cache behavior is a per-workload property
SQL pattern
Cache hit rate and estimated savings by app, trailing 30 daysPostgreSQL
SELECT
  app_name,
  SUM(requests) AS requests,
  SUM(cache_hits) AS cache_hits,
  ROUND(
    100.0 * SUM(cache_hits) / NULLIF(SUM(requests), 0), 1
  ) AS cache_hit_rate_pct,
  ROUND(
    SUM(cache_hits) * (SUM(cost_usd) / NULLIF(SUM(requests) - SUM(cache_hits), 0)), 2
  ) AS est_savings_usd
FROM llm_request_rollups
WHERE window_start >= CURRENT_DATE - INTERVAL '30 days'
  AND environment = 'production'
GROUP BY app_name
ORDER BY est_savings_usd DESC;
Common pitfalls
Mixing response-cache and prompt-cache rates into one number.→ They're different mechanisms with different economics — a response-cache hit skips the call entirely; a prompt-cache hit discounts part of one. Track them as separate metrics.
Assuming cached means free.→ Provider prompt-cache reads are discounted (often 50-90%), not free, and cache writes can cost extra. Compute savings from your recorded costs, not from 'hits × full price'.
Chasing a global hit-rate target.→ A support-FAQ bot should cache heavily; a creative-generation feature shouldn't. Judge each app against its own achievable ceiling, not a fleet-wide goal.
Not alerting on cache regressions.→ A prompt template change that breaks prefix stability can silently halve the hit rate and show up later as a cost spike. Alert on per-app drops, since the fleet average moves slowly.
Where does this metric apply?
This metric commonly uses data from Helicone request logs, gateway and proxy caches, provider prompt-caching fields, Langfuse cost rollups, plus any
warehouse models that provide the same grain of LLM usage data.
For response caching, divide cache hits by total requests per window — proxies like Helicone record the hit flag per request. For provider prompt caching, divide cached prompt tokens by total prompt tokens from the usage fields. Report the two separately; they answer different questions.
What is a good cache hit rate?
Whatever your workload's repetition supports: high-traffic support and search-style features can exceed 50% response-cache hits, while long-tail creative workloads may honestly sit near zero. Prompt caching is different — any app with a large stable system prompt should see high cached-token share, and a low one usually means the prompt prefix churns on every request.
Why did my cache hit rate drop after a deploy?
Prompt-template changes are the usual cause: provider prompt caches key on stable prefixes, so reordering the system prompt or injecting a timestamp near the top invalidates every entry. Semantic and response caches are similarly sensitive to prompt normalization. The fix is structural — keep volatile content at the end of the prompt — and the metric is how you catch it within a day instead of on the invoice.