What is token usage, and how do you track it in Metabase?
What does a token usage chart look like in Metabase?
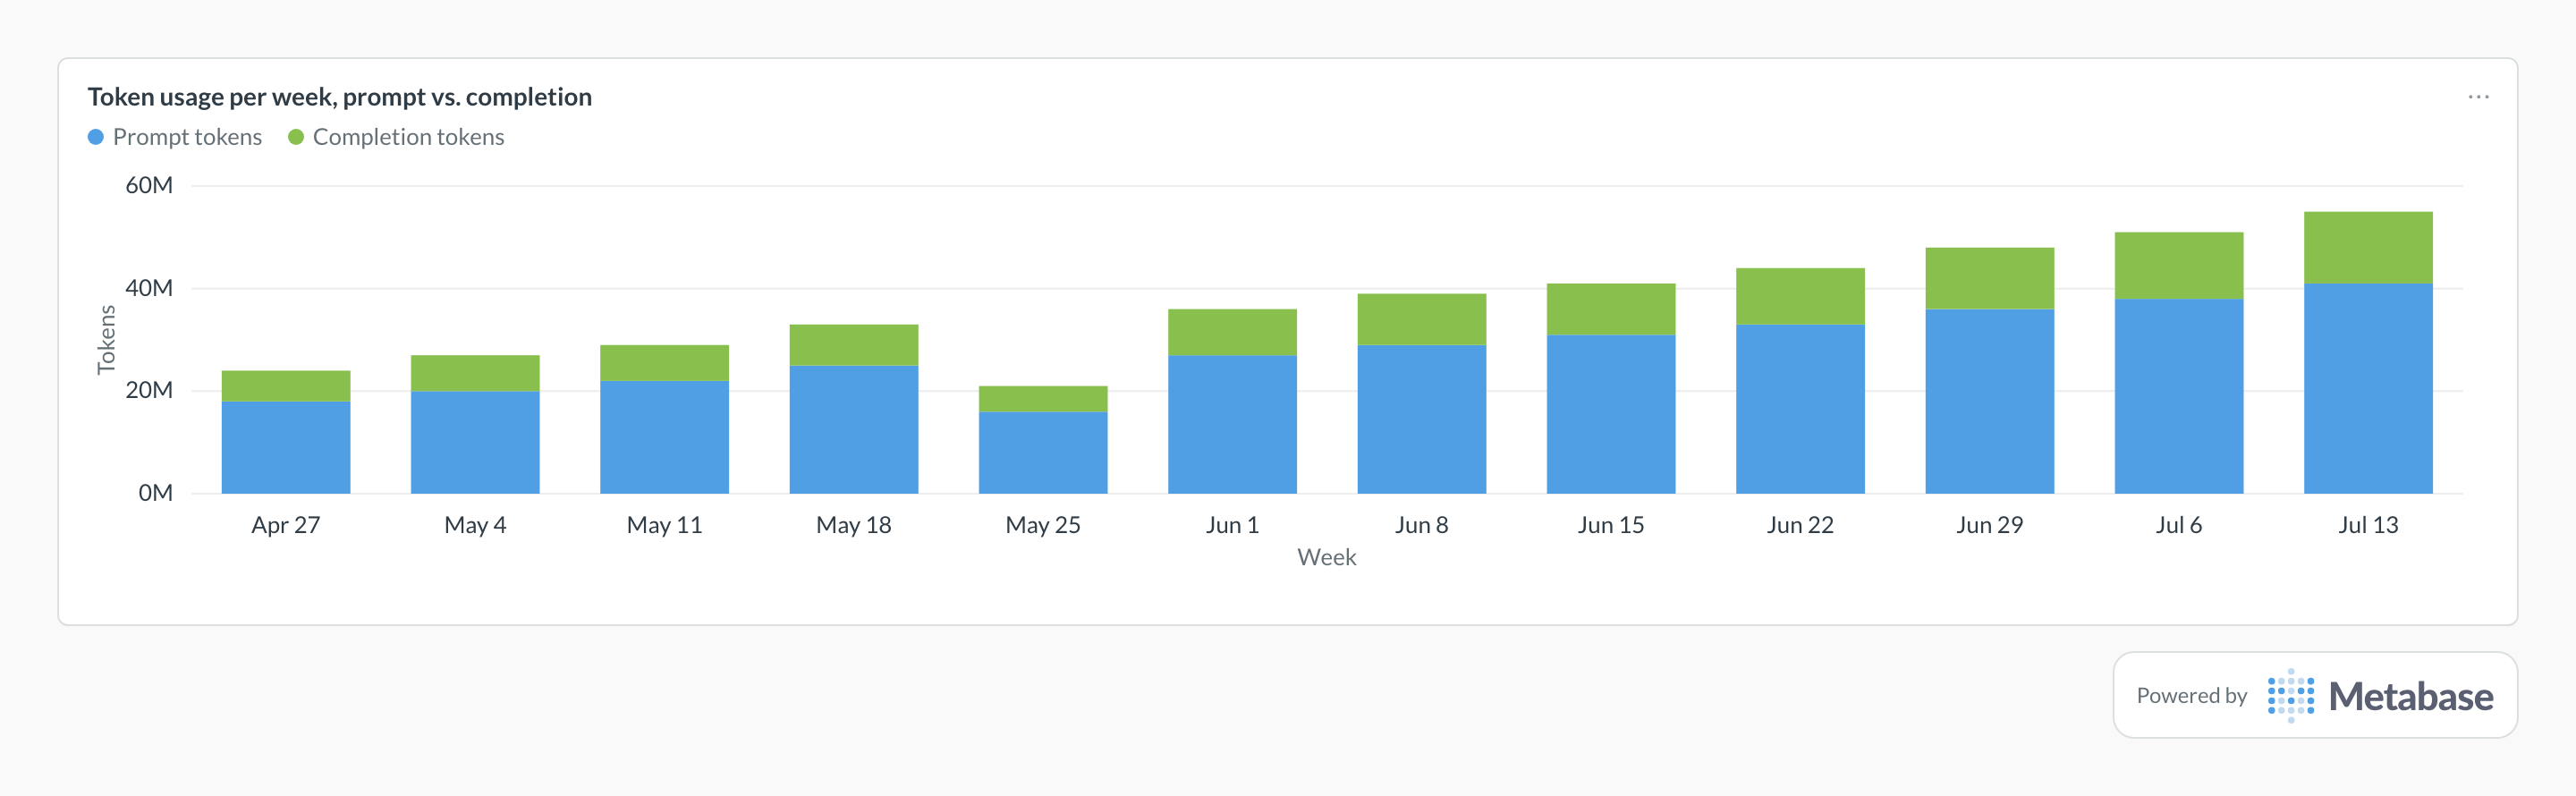
Stack prompt and completion tokens per week and read the mix as well as the total: the steady climb tracks adoption, with prompt tokens carrying roughly three quarters of the volume. A one-week dip like May 25's usually lines up with a holiday, not a lost workload — annotate it and move on.
Token usage as a Metabase card, built from synced LLM
analytics data. Figures are illustrative.
Definition
Token usage is the volume of tokens your LLM applications consume per period — prompt (input) tokens and completion (output) tokens, tracked separately by model, app, and environment. It's the raw material of every LLM cost and capacity question: spend is tokens times price, latency grows with completion length, and rate limits are usually token-denominated.
Formula: SUM(prompt_tokens) and SUM(completion_tokens) per window, segmented by model and app — never just their undifferentiated total
What data do you need?
Daily rollups per model and app with prompt_tokens and completion_tokens as separate columns
Reasoning-token counts where models report them (they price and behave differently)
App, feature, and environment tags carried from request metadata
Request counts alongside tokens so per-request sizes are computable
SQL pattern
Token usage by model by week, prompt vs. completionPostgreSQL
SELECT
  model,
  date_trunc('week', window_start) AS week,
  SUM(prompt_tokens) AS prompt_tokens,
  SUM(completion_tokens) AS completion_tokens,
  ROUND(
    1.0 * SUM(prompt_tokens) / NULLIF(SUM(completion_tokens), 0), 2
  ) AS prompt_completion_ratio
FROM llm_request_rollups
WHERE environment = 'production'
GROUP BY model, 2
ORDER BY 2, prompt_tokens DESC;
Common pitfalls
Reporting one combined token number.→ Prompt and completion tokens are priced differently — often by 3-5× — and move for different reasons. A flat total hides a prompt-bloat problem behind a completion-length win. Keep them as separate columns everywhere.
Ignoring the prompt:completion ratio.→ A climbing ratio usually means context stuffing — RAG pipelines or history windows growing silently. It's the earliest cheap-to-fix cost signal, visible weeks before the spend chart bends.
Comparing token counts across providers as if they were equal.→ Tokenizers differ — the same text can tokenize 10-20% apart between model families. Compare trends per model, and use cost rather than raw tokens for cross-provider comparisons.
Counting cached tokens at full weight.→ Cached prompt tokens are usually discounted and shouldn't inflate capacity or cost projections. Keep cached-token counts as their own column where the gateway reports them.
Where does this metric apply?
This metric commonly uses data from Langfuse traces and rollups, Helicone request logs, OpenRouter activity exports, LangSmith runs, Arize Phoenix spans, plus any
warehouse models that provide the same grain of LLM usage data.
Sync daily rollups per model and app — with prompt and completion tokens as separate columns — from a tracing tool or gateway such as Langfuse, Helicone, or OpenRouter into a warehouse, then chart weekly sums and the prompt:completion ratio. Trace-grain data adds per-request distributions when you need them.
Why is token usage rising faster than requests?
Per-request token growth: longer prompts (growing context windows, RAG stuffing, accumulated chat history) or longer completions (verbose system prompts, reasoning models). Divide tokens by requests per app to find which surface is inflating, then check whether the prompt or completion side moved.
Do reasoning tokens count as completion tokens?
Providers report them differently — some fold them into completion tokens, some expose a separate reasoning_tokens field, and they're often priced at the completion rate despite never reaching the user. Where the field exists, keep it separate: a reasoning-heavy model can double effective cost per visible output token.