What is eval pass rate, and how do you track it in Metabase?
What does an eval pass rate chart look like in Metabase?
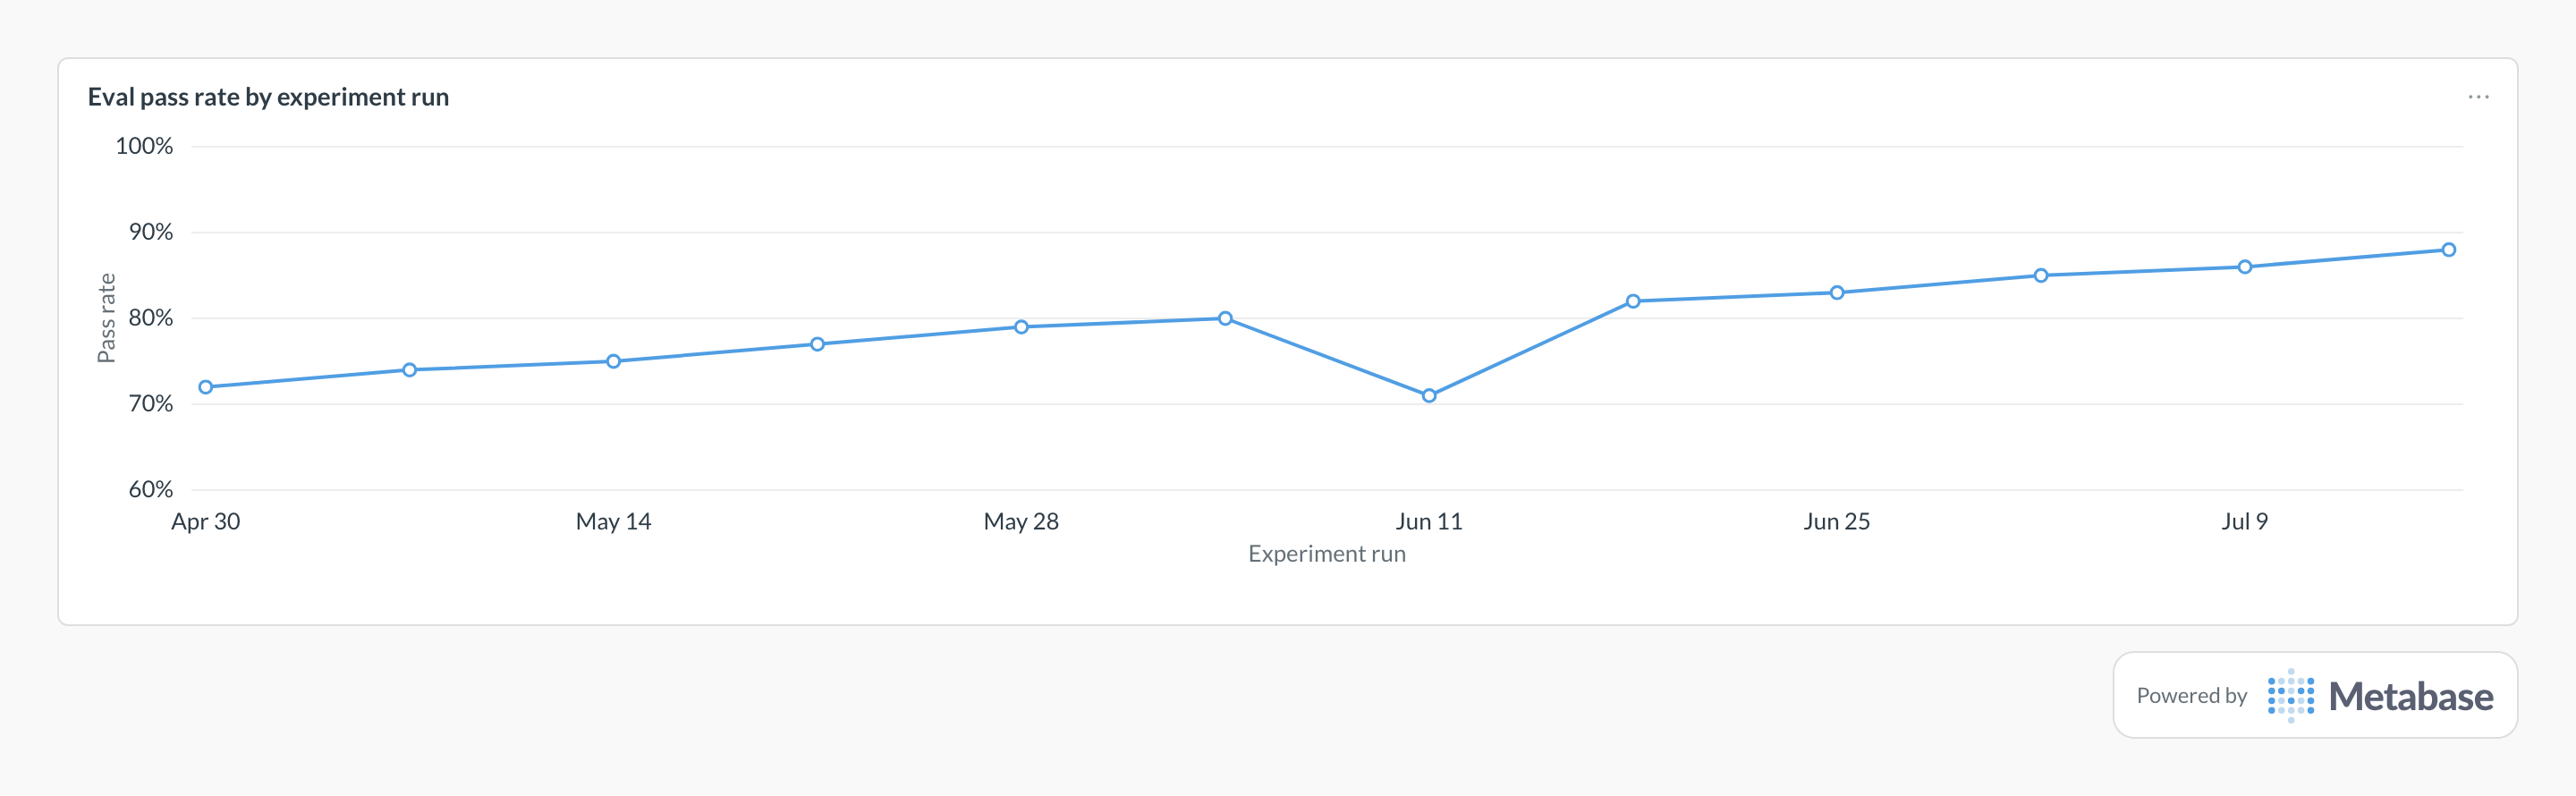
Chart the pass rate for each experiment run on a fixed dataset and scorer set, and read progress run over run rather than any single score. The climb from the low 70s toward 90% is prompt and model iterations compounding, while a dip like Jun 11's flags a regressed prompt version — the kind you roll back before it ships.
Eval pass rate as a Metabase card, built from synced LLM
analytics data. Figures are illustrative.
Definition
Eval pass rate is the share of evaluation examples that pass their scorer's threshold in a run — the closest thing LLM development has to a test-suite green rate. Tracked over time on stable datasets and scorers, it turns 'the new prompt feels better' into a measured claim, and its per-scorer breakdown shows exactly which quality dimension moved.
Formula: COUNT(passed) ÷ COUNT(examples) per experiment — comparable only within the same dataset version and scorer set
What data do you need?
Eval results at example grain: experiment, dataset, scorer, score, pass flag, created-at
Experiment metadata: model, prompt version, cost
Dataset and scorer version columns — the comparability keys
Online eval scores from production samples, where run, in the same vocabulary
SQL pattern
Pass rate by experiment with per-scorer breakdownPostgreSQL
SELECT
  experiment,
  scorer,
  MIN(created_at) AS run_at,
  COUNT(*) AS examples,
  ROUND(
    100.0 * COUNT(*) FILTER (WHERE passed) / NULLIF(COUNT(*), 0), 1
  ) AS pass_rate_pct,
  ROUND(AVG(score), 3) AS mean_score
FROM eval_results
GROUP BY experiment, scorer
ORDER BY run_at, scorer;
Common pitfalls
Comparing pass rates across different datasets.→ 90% on an easy dataset and 60% on a hard one say nothing relative to each other. Trend each dataset separately and version datasets when they change.
Changing scorers mid-history.→ An LLM-as-judge prompt tweak shifts every score after it. Version scorers, store the version as a column, and break trend lines at version boundaries.
Watching only the aggregate.→ Scorers can move in opposite directions and net to zero. Keep the per-scorer table, and rank regressed examples by score delta — pass/fail flips lag the drift.
Treating offline pass rate as production quality.→ A dataset covers what you thought to test. Sample production traffic with online evals and report coverage — the share of real usage the evals exercise — next to the rate.
Where does this metric apply?
This metric commonly uses data from Braintrust experiments, LangSmith experiments and datasets, Arize Phoenix evals, W&B Weave evaluations, plus any
warehouse models that provide the same grain of LLM usage data.
Export example-grain eval results from tools like Braintrust, LangSmith, or Phoenix into a warehouse table with experiment, dataset, scorer, score, and pass columns. Chart pass rate per experiment ordered by run time, per dataset — the eval quality dashboard adds the regression and model-comparison views.
What's a good eval pass rate?
Whatever threshold you've decided is shippable for that dataset — pass rates are self-referential, since you set both the scorers and the bar. The valuable signals are relative: is the rate improving run over run, did the candidate model beat the incumbent on the same dataset, and did any scorer regress even while the aggregate rose.
Pass rate or mean score — which should I trend?
Both, for different jobs. Pass rate against a fixed threshold is the ship/no-ship signal and survives scorer scale quirks; mean score shows movement within the passing band, which is where regressions gather before they flip flags. The regression table should rank by score delta for exactly that reason.