




What is p95 LLM latency, and how do you track it in Metabase?
What does a p95 LLM latency chart look like in Metabase?
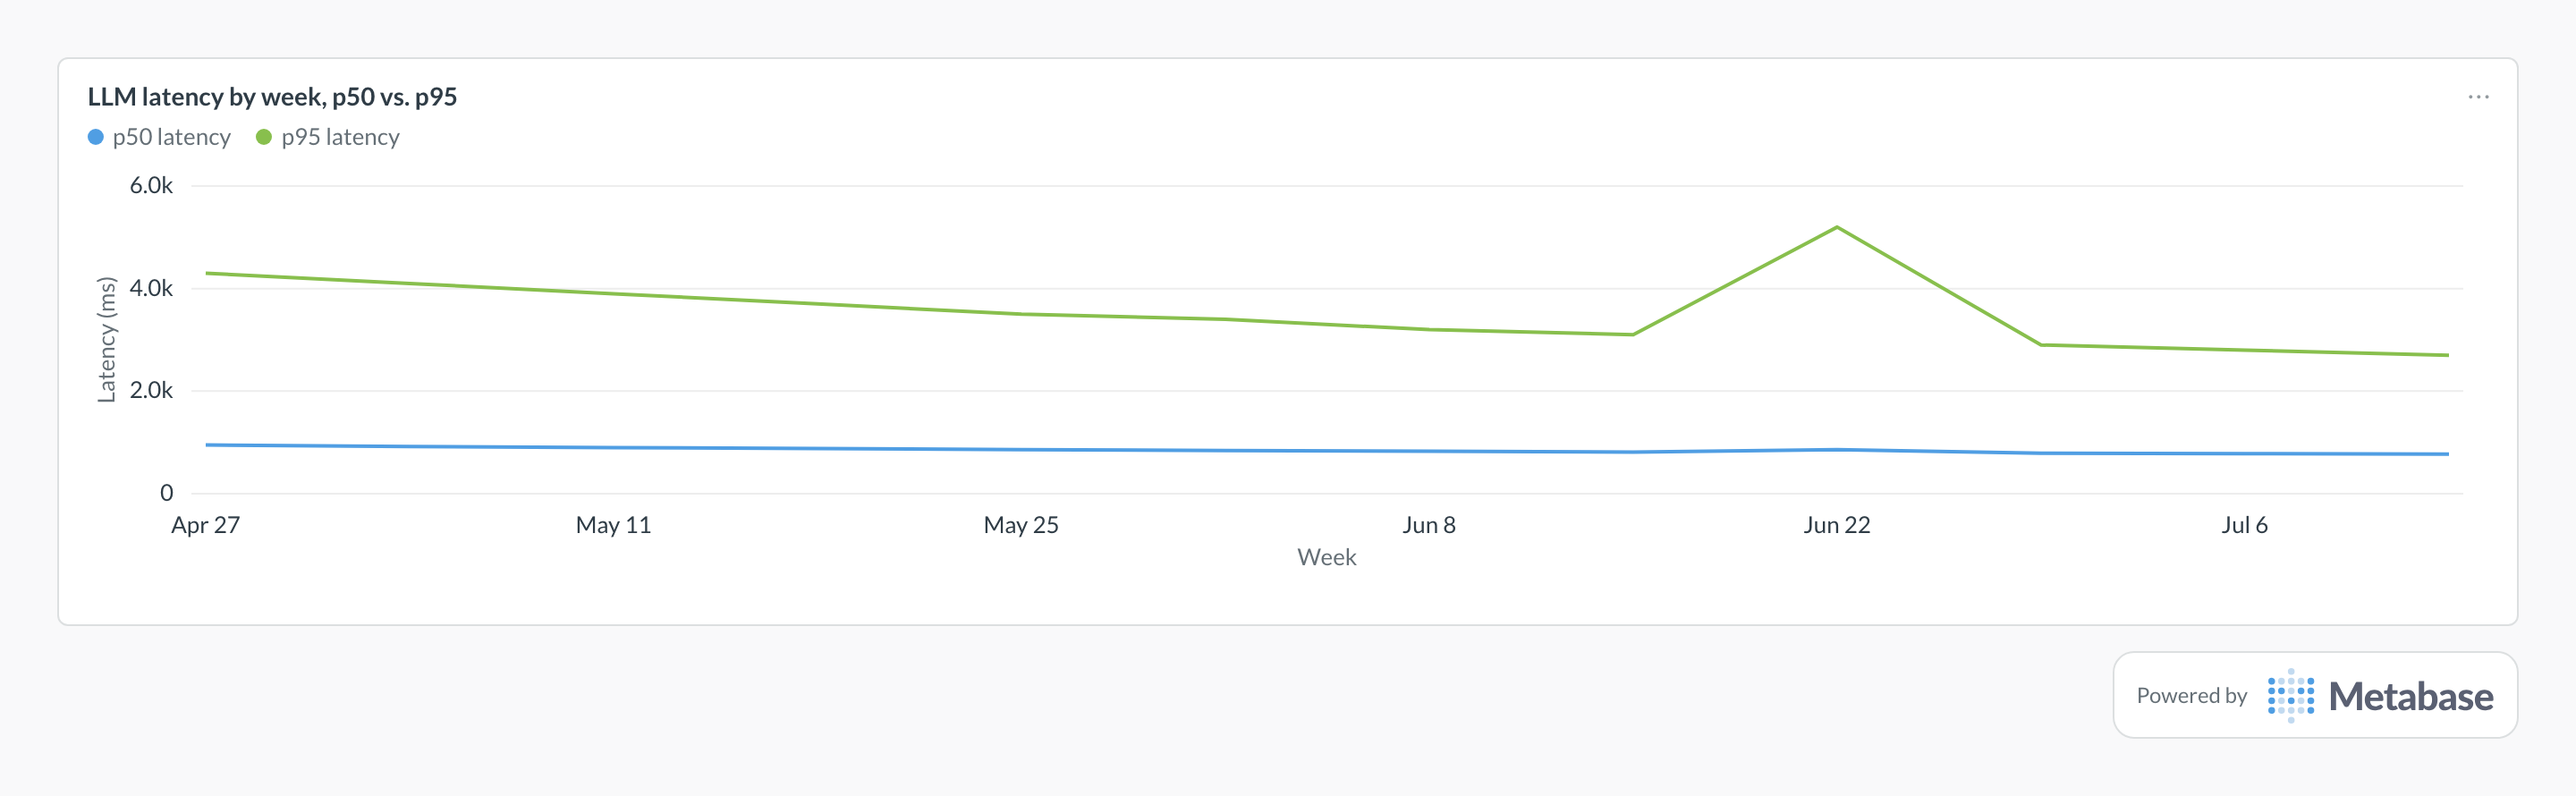
Track p50 and p95 durations as separate weekly lines: the median stays under a second while the tail improves from over four seconds toward three, and that gap is the honest picture averages hide. A p95-only spike like Jun 22's is usually provider-side congestion — the median barely moves, but your slowest users feel it.
Definition
p95 LLM latency is the response time that 95% of LLM calls beat — the tail experience your slowest twentieth of users actually get. LLM latency distributions are stretched far right by long completions, retries, and cold paths, so percentiles, not averages, are the only honest way to report them.
What data do you need?
- Trace-grain durations (started_at, duration_ms) per model and app, or
- Rollups with pre-aggregated p50/p95/p99 columns per window
- Time-to-first-token separately, where streaming is used
- Retry flags so tail latency can be attributed to retries vs. slow single calls
SQL pattern
SELECT
  model,
  date_trunc('week', started_at) AS week,
  COUNT(*) AS calls,
  ROUND(percentile_cont(0.5) WITHIN GROUP (ORDER BY duration_ms))
    AS p50_ms,
  ROUND(percentile_cont(0.95) WITHIN GROUP (ORDER BY duration_ms))
    AS p95_ms
FROM llm_traces
WHERE environment = 'production'
  AND status = 'success'
GROUP BY model, 2
ORDER BY 2, p95_ms DESC;
Common pitfalls
Where does this metric apply?
This metric commonly uses data from Langfuse traces, Arize Phoenix spans, W&B Weave traces, Helicone request logs, plus any warehouse models that provide the same grain of LLM usage data.
Related
Dashboards
Integrations
Metrics
Analytics
FAQ
How do you measure p95 latency for LLM calls in Metabase?
percentile_cont(0.95) over durations grouped by model and week — tracing tools like Langfuse and Arize Phoenix export the needed timestamps. From rollups, store p95 pre-aggregated per window and read it at that grain; percentiles can't be recombined afterwards.