What is LLM requests per day, and how do you track it in Metabase?
What does an LLM requests per day chart look like in Metabase?
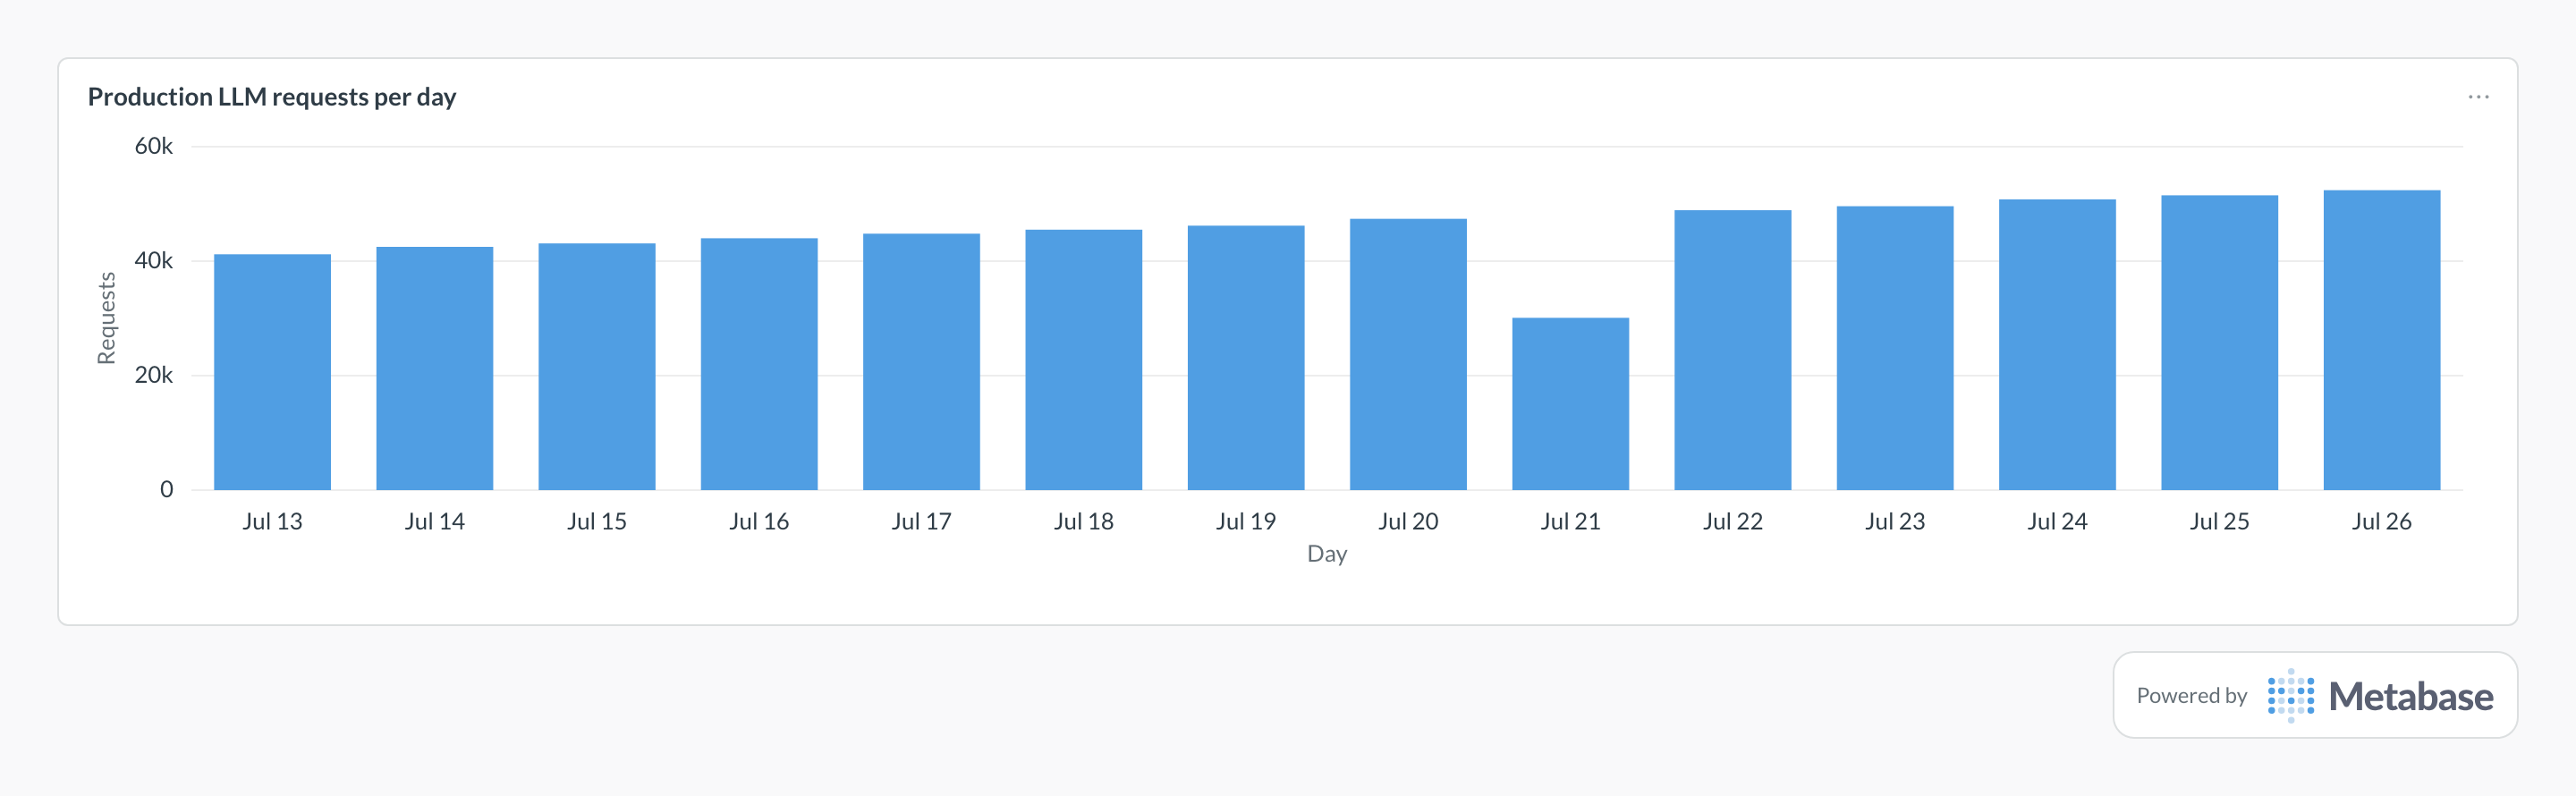
Chart daily production request counts as bars and read adoption from the climb — steadily rising volume is the denominator behind every other LLM metric moving. A one-day crater like Jul 21's is almost always a provider outage rather than lost demand, and volume snaps back the next day.
LLM requests per day as a Metabase card, built from synced LLM
analytics data. Figures are illustrative.
Definition
LLM requests per day is your daily LLM call volume, segmented by app, model, and environment. It's rarely the interesting number itself — it's the denominator that makes every other LLM metric honest: error rates, cost per request, cache hits, and latency percentiles all mean nothing without the volume behind them.
Formula: COUNT(requests) per day, per app/model/environment — with production separated from test and playground traffic
What data do you need?
Daily rollups per app, model, and environment with request counts
Retry flags so attempts and user-visible requests can be counted separately
API-key or client identifiers to catch runaway automation
History long enough for seasonality — weekday/weekend patterns are strong
SQL pattern
Requests per day by app with a 7-day moving averagePostgreSQL
SELECT
  date_trunc('day', window_start) AS day,
  app_name,
  SUM(requests) AS requests,
  ROUND(AVG(SUM(requests)) OVER (
    PARTITION BY app_name
    ORDER BY date_trunc('day', window_start)
    ROWS BETWEEN 6 PRECEDING AND CURRENT ROW
  )) AS requests_7d_avg
FROM llm_request_rollups
WHERE environment = 'production'
GROUP BY 1, app_name
ORDER BY 1, requests DESC;
Common pitfalls
Counting retries and fallback attempts as demand.→ A degrading provider can double 'volume' overnight. Count user-visible requests for demand, attempts for capacity, and keep both columns.
Mixing environments.→ Load tests and CI eval suites produce huge bursts. Headline volume is production-only; everything else stays filterable.
Reading raw daily counts without smoothing.→ Weekday/weekend swings hide real inflections. Trend a 7-day moving average, and keep the raw line for spike forensics.
Not watching per-key volume.→ A runaway agent loop or a leaked API key shows up first as one key's volume detaching from the pack. Keep a per-key table with day-over-day deltas.
Where does this metric apply?
This metric commonly uses data from Helicone request logs, OpenRouter activity exports, Langfuse traces, Arize Phoenix spans, plus any
warehouse models that provide the same grain of LLM usage data.
How do you track LLM requests per day in Metabase?
Sync daily request rollups per app and model from your gateway or tracing tool — Helicone, OpenRouter, and Langfuse all expose them — and chart the 7-day moving average by app. Keep environment and API key as filterable columns.
Why does request volume matter if cost is what leadership asks about?
Because every cost and reliability number is a ratio over it. Spend rising 40% on volume rising 60% is improving efficiency; a 2% error rate on 100 requests is noise while on a million it's an incident. Volume is the context card on the spend overview and latency & errors dashboards for exactly that reason.
What volume spike patterns should alerting watch?
Three shapes: a single API key detaching from the pack (leaked key or runaway agent loop), volume rising with flat active users (per-user usage inflation — often an agent retrying or a feature over-calling), and attempt volume rising with flat user-visible volume (retry storms). Each has a different first responder, which is why the segmented views exist.