




What is cost per 1M tokens, and how do you track it in Metabase?
What does a cost per 1M tokens chart look like in Metabase?
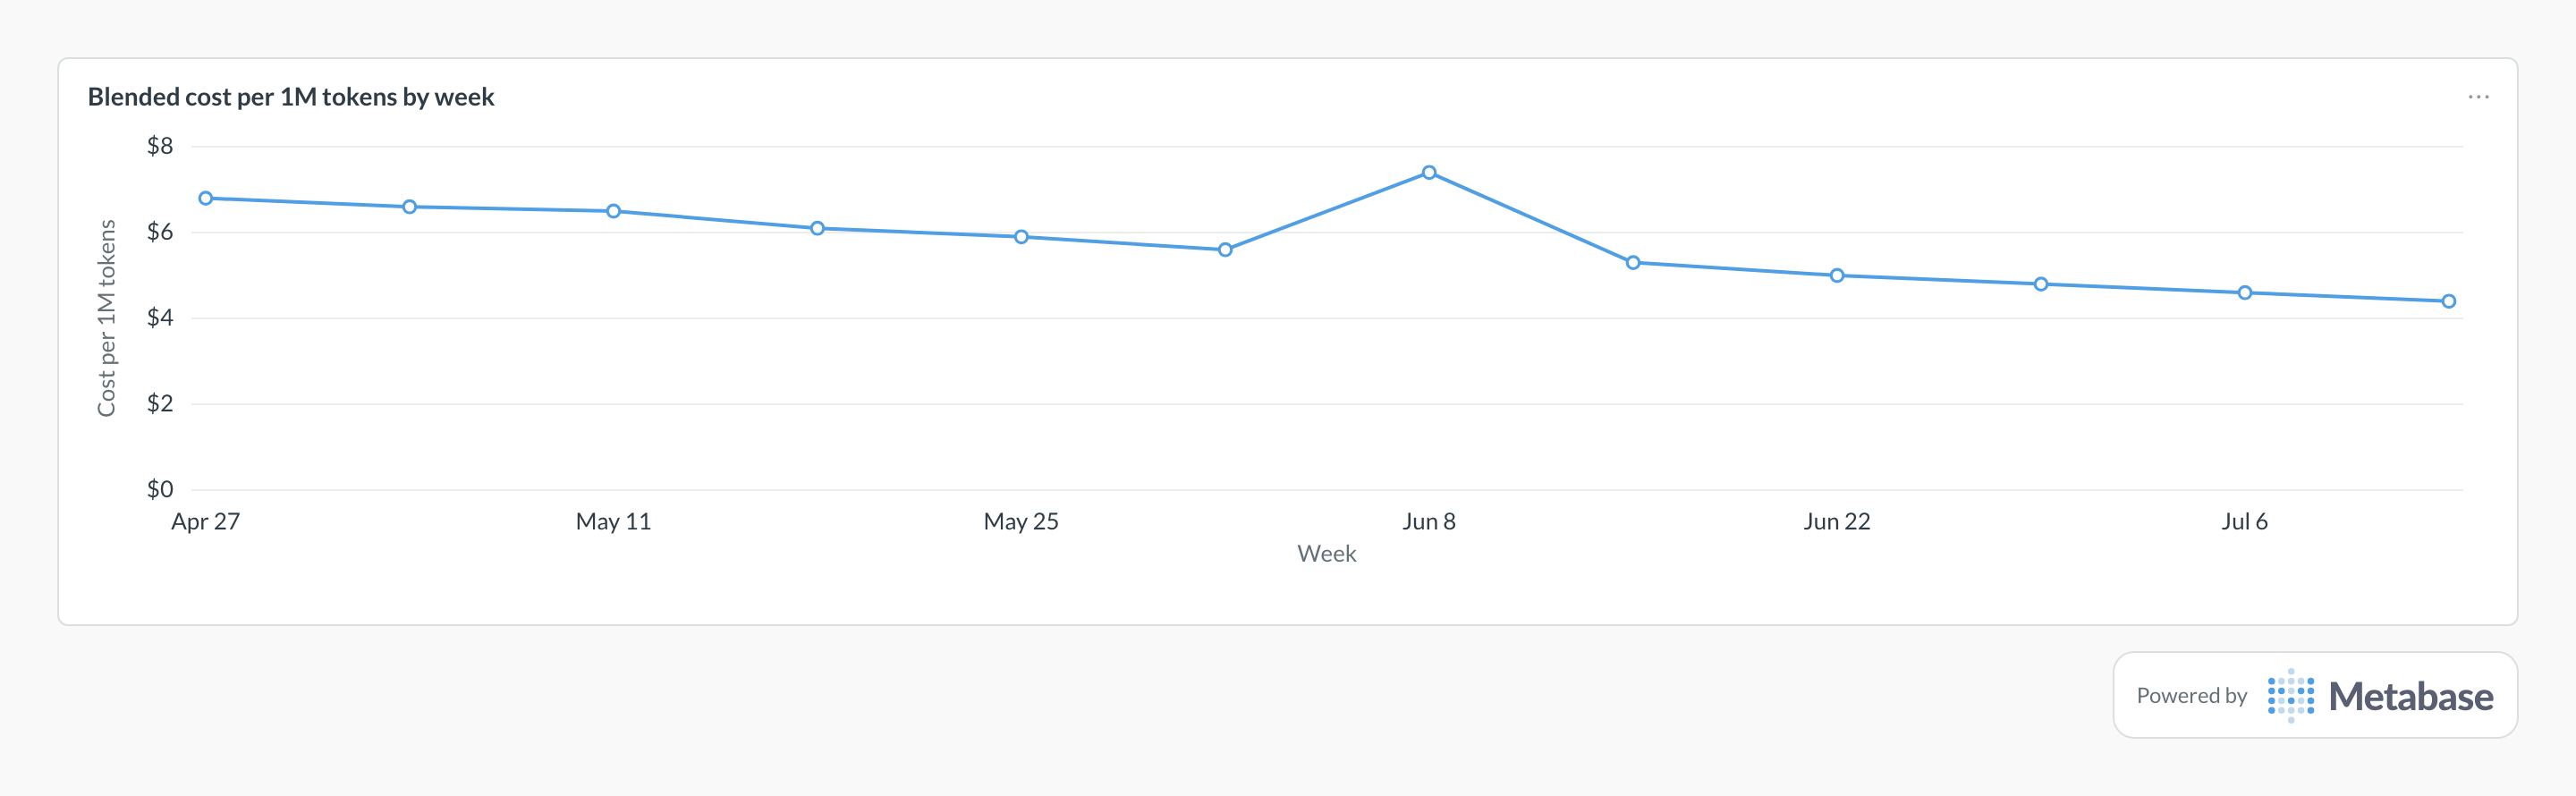
Chart the blended rate as a weekly line and read the slope: the steady decline is cheaper models and better caching doing their job. A one-week spike like Jun 8's usually means traffic failed over to a pricier model during a provider incident — worth confirming before anyone renegotiates a budget.
Definition
Cost per 1M tokens is your effective, blended unit cost: total LLM spend divided by total tokens, normalized per million. Unlike a provider's published per-direction list price, it reflects your real mix of prompt and completion tokens, cache and batch discounts, and retries — which makes it the honest number for comparing models and catching cost drift.
What data do you need?
- Daily rollups per model with cost and token columns from the same source
- Cache and batch discount fields where recorded, so the blended rate is explainable
- Model metadata (list prices) if you want a drift-vs-list comparison column
- Environment tags to keep test traffic out of the unit cost
SQL pattern
SELECT
  model,
  SUM(requests) AS requests,
  SUM(prompt_tokens + completion_tokens) AS total_tokens,
  ROUND(SUM(cost_usd), 2) AS cost_usd,
  ROUND(
    1e6 * SUM(cost_usd)
    / NULLIF(SUM(prompt_tokens + completion_tokens), 0), 2
  ) AS cost_per_1m_tokens
FROM llm_request_rollups
WHERE window_start >= CURRENT_DATE - INTERVAL '30 days'
  AND environment = 'production'
GROUP BY model
ORDER BY cost_usd DESC;
Common pitfalls
Where does this metric apply?
This metric commonly uses data from Helicone request logs, OpenRouter activity exports, Langfuse cost rollups, Braintrust production logs, plus any warehouse models that provide the same grain of LLM usage data.
Related
Dashboards
Integrations
Metrics
Analytics
FAQ
How do you calculate cost per 1M tokens?
1e6 * SUM(cost_usd) / SUM(prompt_tokens + completion_tokens), per model. Use the cost your gateway or tracing tool records at request time; it already reflects caching and batch discounts where the provider applies them.