What is LLM error rate, and how do you track it in Metabase?
What does an LLM error rate chart look like in Metabase?
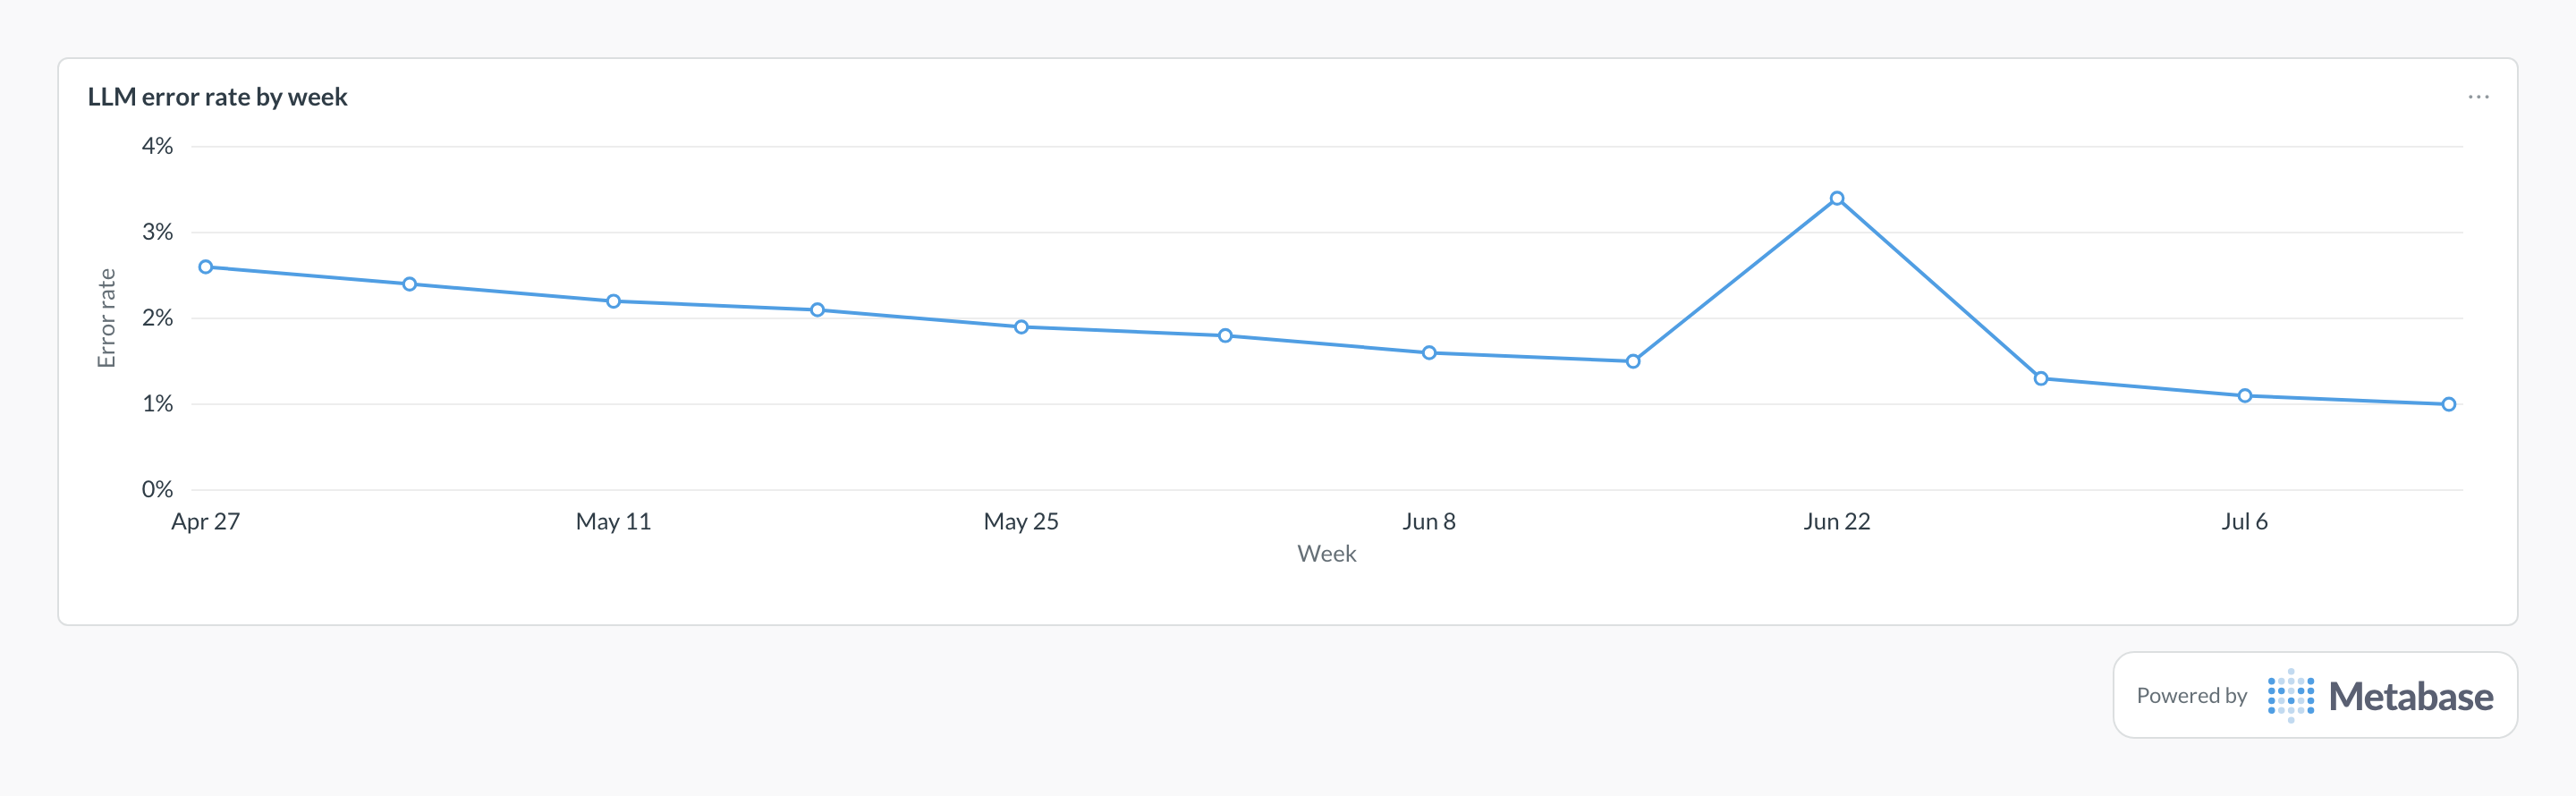
Chart failed calls as a share of all requests per week and read the trend rather than any single point: the decline toward 1% reflects retries and fallbacks maturing. An isolated spike like Jun 22's almost always traces to a provider incident — correlate it with provider status history before blaming your own deploys.
LLM error rate as a Metabase card, built from synced LLM
analytics data. Figures are illustrative.
Definition
LLM error rate is the share of LLM calls that fail — provider errors, timeouts, rate limits, and guardrail or content-filter blocks — out of all calls in a window. The single headline rate keeps features honest; the breakdown by error type is what makes it actionable, because each type has a different owner and a different fix.
Formula: SUM(error_count) ÷ SUM(requests) per window — plus the same rate segmented by error type and app
What data do you need?
Rollups with requests and error counts per model, app, and window
An error-type column: provider, timeout, rate_limit, guardrail
Retry and fallback flags to separate user-visible failures from raw attempt failures
Environment tags so test noise stays out of the headline
SQL pattern
Error rate by app and error type, trailing 30 daysPostgreSQL
SELECT
  app_name,
  error_type,
  SUM(error_count) AS errors,
  SUM(requests) AS requests,
  ROUND(
    100.0 * SUM(error_count) / NULLIF(SUM(requests), 0), 2
  ) AS error_rate_pct
FROM llm_error_rollups
WHERE window_start >= CURRENT_DATE - INTERVAL '30 days'
  AND environment = 'production'
GROUP BY app_name, error_type
ORDER BY error_rate_pct DESC;
Common pitfalls
Counting guardrail blocks as infrastructure failures.→ A content-filter block is a policy event, not an outage. Track it as its own type — a rising guardrail rate points at prompts or policy, and its fix belongs to a different team than a 5xx.
Hiding failures behind successful retries.→ Report both user-visible failure rate (after retries/fallbacks) and raw attempt failure rate. A resilience layer quietly absorbing a degrading provider is a story you want early.
One global rate across apps and models.→ A background batch job at 4% and a user-facing chat at 4% are different emergencies. Segment by app and model; set targets per surface.
No denominator context.→ Error rates on tiny volumes swing wildly. Keep request volume on the same card, and suppress or annotate low-volume segments.
Where does this metric apply?
This metric commonly uses data from Langfuse traces, Helicone request logs, Arize Phoenix spans, W&B Weave traces, plus any
warehouse models that provide the same grain of LLM usage data.
Anything where the caller didn't get a usable completion: provider 5xx and overload errors, timeouts, rate-limit rejections, and guardrail or content-filter blocks. Define the categories once, store them as a column, and keep 'empty or malformed output' as a quality signal for evals rather than this metric — mixing the two muddies both.
How do you track LLM error rate in Metabase?
Sync per-window error and request counts, with an error-type column, from your tracing tool or gateway — Langfuse, Helicone, and Phoenix all record failure status on traces. Chart the headline rate by week and the stacked-by-type view; the latency & errors dashboard pairs both with retries.
What's an acceptable LLM error rate?
After retries and fallbacks, user-facing surfaces generally target well under 1% — but raw attempt rates run meaningfully higher, especially during provider incidents. The more useful discipline is per-surface targets plus alerting on type-level shifts: a rate-limit climb means capacity planning, a provider-error climb means incident correlation and maybe a fallback change.