What is a breakout?
A breakout is the grouping of aggregated results by one or more dimensions, like the count of users grouped (or broken out) by country. The column you choose to group by is sometimes known as a breakout column.
In native SQL queries, the GROUP BY statement serves a similar function, separating and organizing results based on whatever dimension(s) you’ve specified.
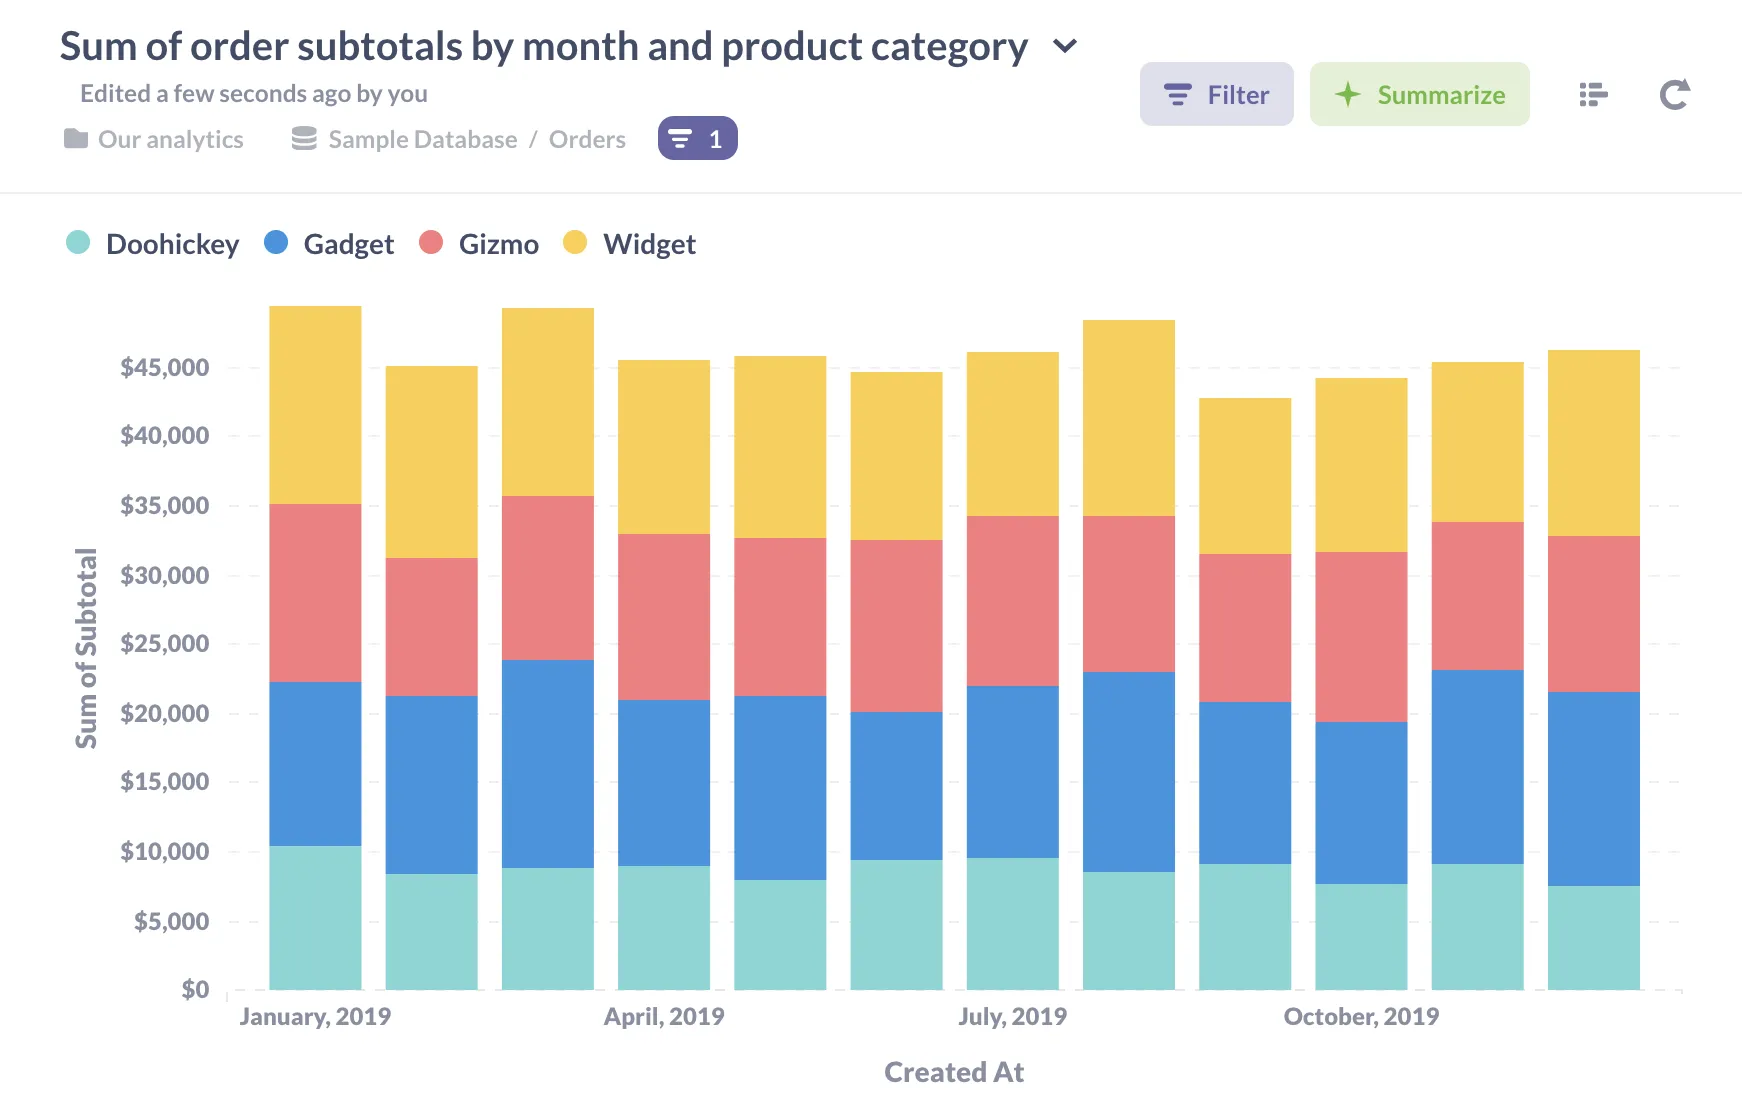
Example breakout in Metabase
Figure 1 shows a metric (sum of order subtotal), broken out by two dimensions: 1) the month an order was placed and 2) the product category. Here we’ve visualized this breakout as a stacked bar chart.
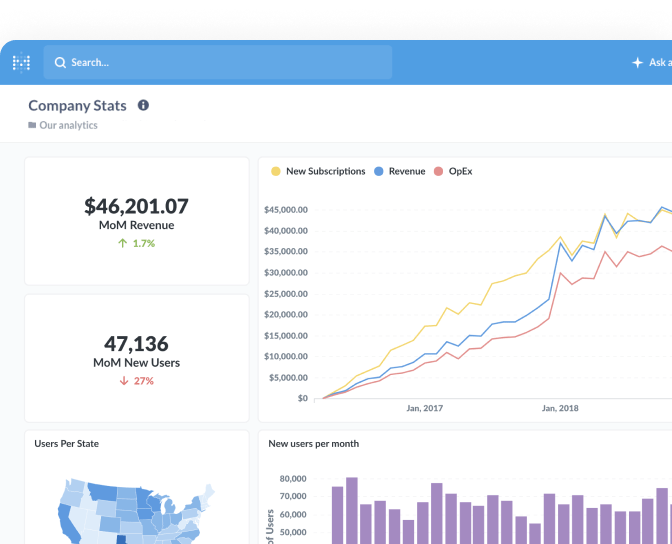
You can also break out your data when drilling through on a chart in Metabase. Clicking on a chart like this brings up the drill-through menu, where you can further break out your data. In figure 2, we’ve used the action menu to break out a subset of our data by the Vendor of the product ordered.