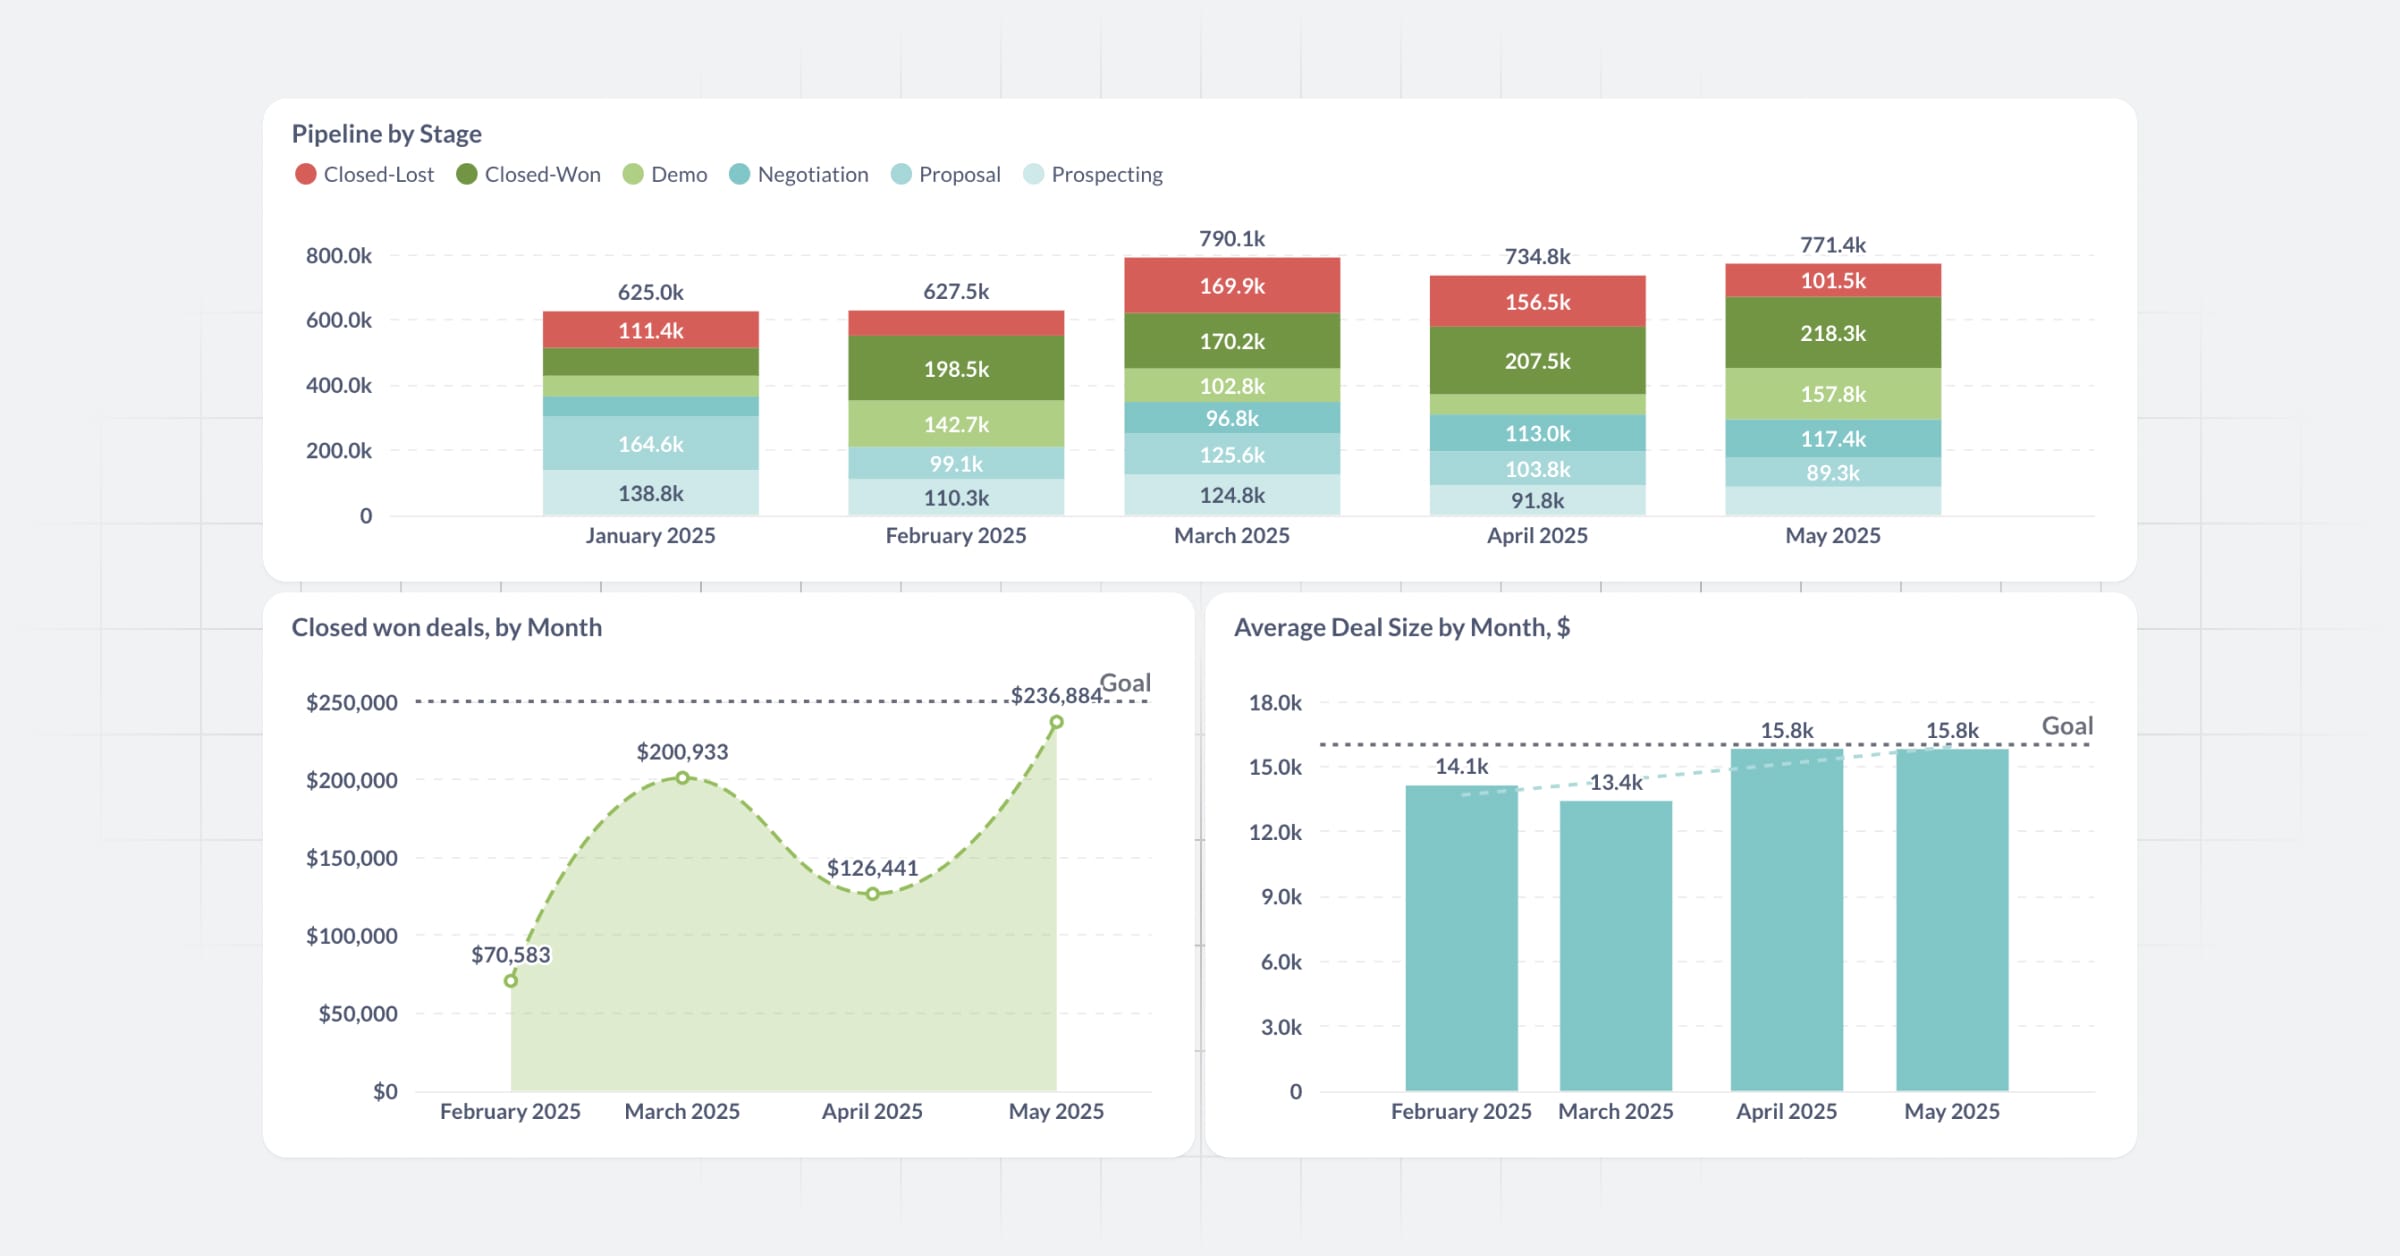
Querying and dashboards
Identifying trends, building reports, setting up alerts, and more.

Asking questions
How to use Metabase's query builder to ask better questions.
Create interactive charts
Build charts that people can explore by using the query builder, building models, or adding custom destinations.
4 min read
Custom expressions
When you should use custom expressions and why you should take advantage of them in Metabase's notebook editor.
7 min read
Joins in Metabase
How to join tables in Metabase using the notebook editor in simple and custom questions.
8 min read
Combining data from different databases
How to join tables from different databases in Metabase.
7 min read
Multi-level aggregation
How to ask questions with multiple parts using the query builder.
2 min read
Searching in tables
Learn how to search within your SQL questions and simple questions using filters and custom expressions. Finding words or phrases in your tables is now easier than ever.
5 min read
Cleaning and formatting text
How to use custom expressions to clean up text that's inconsistent, unstructured, or blank.
7 min read
Visualizing data
Charts, maps, gauges, funnels, tables, numbers, and more.
Which chart should you use?
Which type of charts and graphs should you use to best communicate insights from data? This guide will help you pick the right visualization for the job.
9 min read
Guide to line charts
What we talk about when we talk about line charts: time series, trend lines, alerts, and more.
5 min read
Master the bar chart
Create a bar chart and customize it with visualization settings.
2 min read
Histograms
Learn when to use a histogram, and how Metabase makes it easy to create histograms.
2 min read
Building dashboards
How to build interactive dashboards.
BI dashboard best practices
Learn how to make great business intelligence dashboards.
9 min read
Linking filters in dashboards
Link filters in dashboards to limit the choices available in one filter based on the current selection of another filter.
3 min read
Custom click destinations on dashboards
You can set up dashboard cards to send people to dashboards, saved questions, and URLs, and use values from the card to update filters at the destination, or parameterize links to external sites.
10 min read
Cross-filtering: using a chart to update a dashboard filter
With just a few clicks, you can configure any chart or table to update a dashboard filter.
4 min read
Markdown in dashboards
How to use Markdown in your dashboards for fun and profit.
6 min read
Build a record lookup tool with Metabase
How to use Metabase to build an internal lookup tool to quickly find details about your customers, orders, or other data.
8 min read
SQL in Metabase
How to work with SQL in Metabase.
Create filters using SQL variables
How to create filter widgets in native SQL queries using basic input variables for text, numbers, and dates.
7 min read
Field filters for SQL questions
Learn how to use Metabase Field Filters in SQL queries to build smarter filter widgets.
6 min read
Snippets: reuse and share code
Learn everything you need to know about using snippets in native code.
6 min read
Snippets vs. Saved Questions vs. Views
Learn about the Metabase features you can use to keep your SQL code organized.
4 min read
Adding filters to dashboards with SQL questions
How to add filter widgets to dashboards and connect them to Field Filter variables in a SQL question.
5 min read
SQL trick: ordering bars in a chart
A simple trick to preserve the order you want the bars to appear in a chart.
1 min read
Time series analysis
How to put all that historical data to good use.
Overview of time series analysis
An overview of methods you can use to track progress, estimate impact, and more.
2 min read
Period-over-period comparisons for time series
How to measure the change in a metric over time by comparing two or more time periods.
7 min read
Best practices for visualizing time series
Tell a story by organizing time series charts on the same dashboard.
6 min read
Data reference
Discover the tools Metabase provides for learning about your data. These tools include a customizable data dictionary, as well as editing tools for curating your metadata.
Build a basic CRUD app with actions
How to turn a dashboard into a basic CRUD app using actions.
Using Metabase with MongoDB
Visualize and explore your data in MongoDB with Metabase. Run MongoDB native queries and analyze non-tabular data.


