


These are the docs for the Metabase master branch. Some features documented here may not yet be available in the current release. Check out the docs for the current stable version, Metabase v0.62.
Monitoring Your Metabase
Diagnosing performance-related issues can be a challenge. Luckily, the JVM ships with tools that can help diagnose many common issues. Enabling JMX and using a tool like VisualVM can help diagnose issues related to running out of memory, a stalled Metabase, or slow response times.
This guide assumes that you have the VisualVM tool installed locally. VisualVM is included with OpenJDK and the Oracle JDK. You can find VisualJVM in the bin directory of the JDK installation. Some Linux distributions separate VisualVM from the JDK, in which case it’s a separate visualvm package.
Connecting to a local Metabase
If you have VisualVM installed on your Metabase server and are able to run VisualVM there, this is the easiest path as there is no need to setup remote communication with your metabase instance. In this scenario, start Metabase like you would normally and separately start VisualVM.
Connecting to a remote Metabase
Monitoring a remote Metabase instance (or a local instance running in a docker container) is probably more common, but requires a more setup. First we need to specify some system properties that lets the JVM know that we want to allow remote monitoring. Assuming we are running Metabase using java --add-opens java.base/java.nio=ALL-UNNAMED -jar metabase.jar, we’d need change the invocation to the below command, which includes the properties:
java --add-to-start=jmx,jmx-remote \
     -Dcom.sun.management.jmxremote \
     -Dcom.sun.management.jmxremote.port=1099 \
     -Dcom.sun.management.jmxremote.rmi.port=1099 \
     -Dcom.sun.management.jmxremote.authenticate=false \
     -Dcom.sun.management.jmxremote.ssl=false \
     -Dcom.sun.management.jmxremote.local.only=false \
     -Djava.rmi.server.hostname=<Metabase Hostname> \
     -jar metabase.jar
Port 1099 is a typical RMI/JMX port, but it can be any accessible port.
The above command opens up your application to monitoring by anyone and should only be used when on a trusted network for a short period of time. Securing this connection is possible, see the Oracle docs.
If you’re running Metabase in a docker container, you’ll need to specify the system properties detailed above and will also need to ensure the port is open. Docker allows specifying environment variables via a separate file that can be passed into the docker run invocation. You can create a file called metabase-vars.env with JAVA_OPTS specified:
JAVA_OPTS=-Dcom.sun.management.jmxremote.port=1099 -Dcom.sun.management.jmxremote.rmi.port=1099 -Dcom.sun.management.jmxremote.authenticate=false -Dcom.sun.management.jmxremote.ssl=false -Dcom.sun.management.jmxremote.local.only=false -Djava.rmi.server.hostname=<Metabase Hostname>
This file expects to have each environment variable on its own line with no line breaks:
docker run --env-file=metabase-vars.env -d -p 3000:3000 -p 1099:1099 -h <Metabase Hostname> --name metabase metabase/metabase
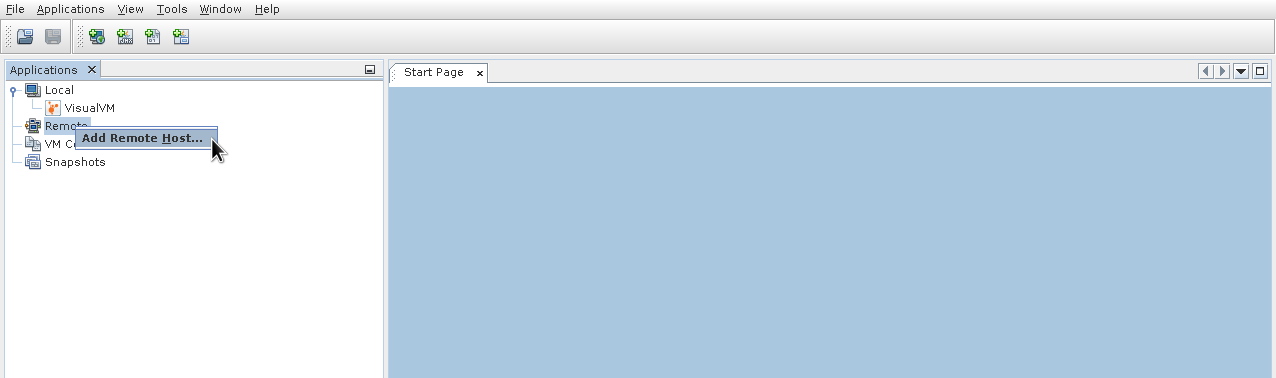
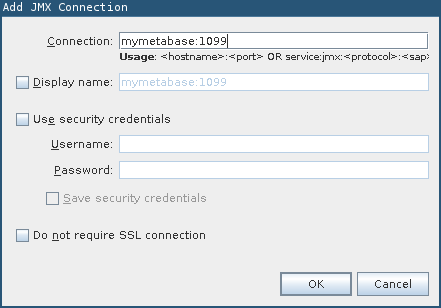
The addition -p 1099:1099 opens the JMX port for monitoring and the --env-file=metabase-vars.env passes in the extra JMX related environment variables. With the instance started, VisualVM needs to know how to connect to the running instance. First add a new remote instance:
Then use the hostname you specified above:
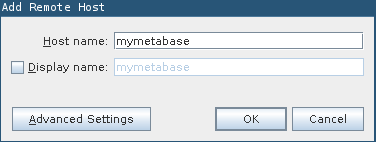
Your local machine must be able to refer to the hostname you specified (which might require a hosts entry):
If you’re using Docker, the port specified for the JMX host needs to match the system property and the exposed port:
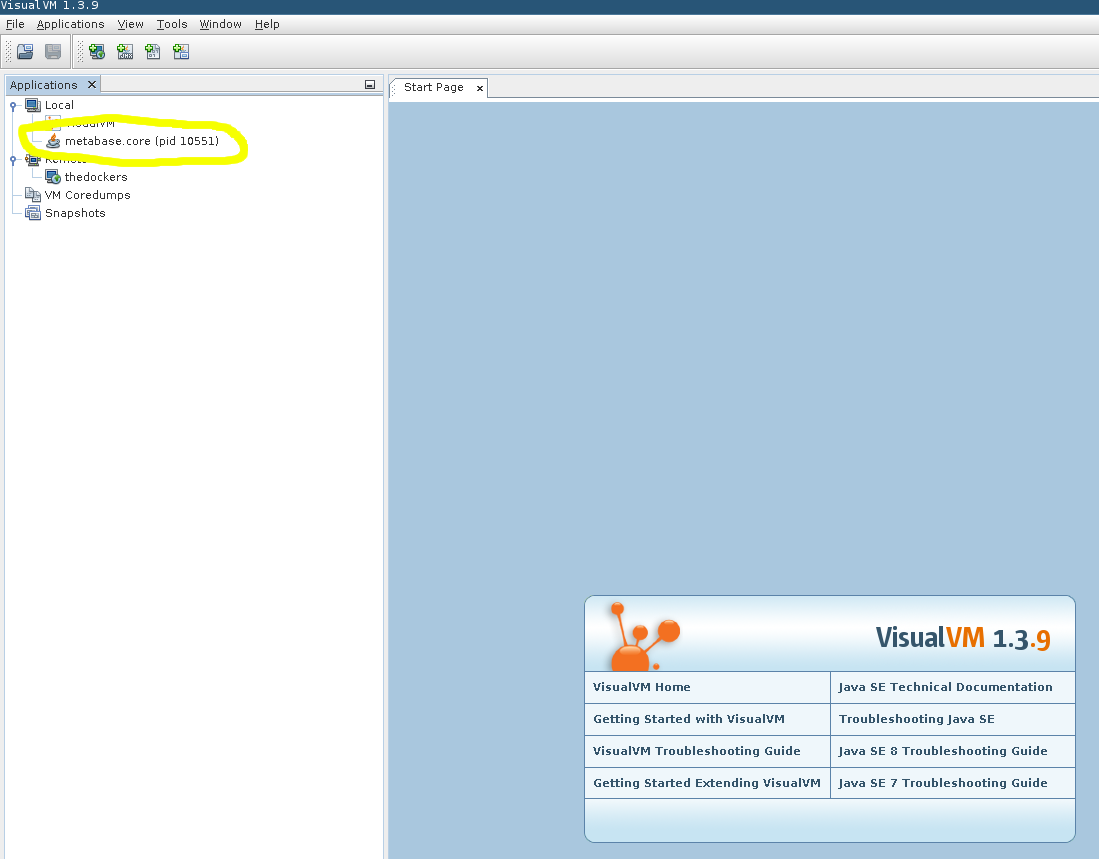
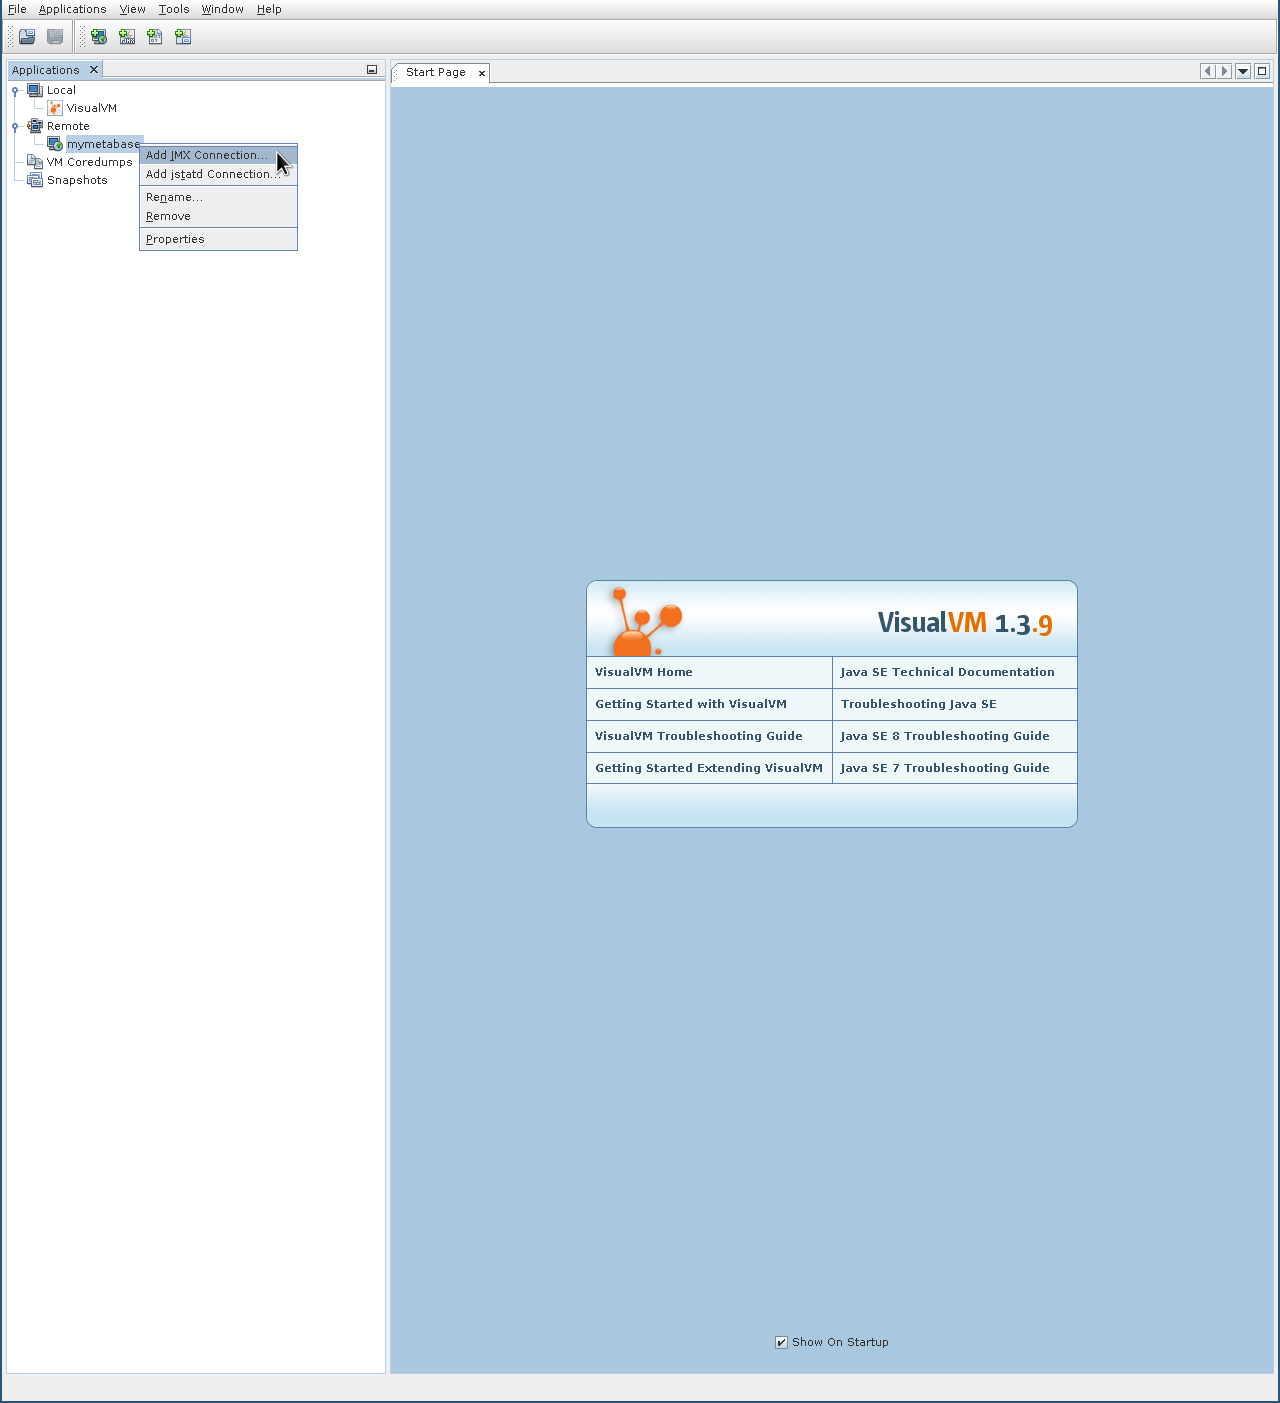
Next open the new remote JMX process:
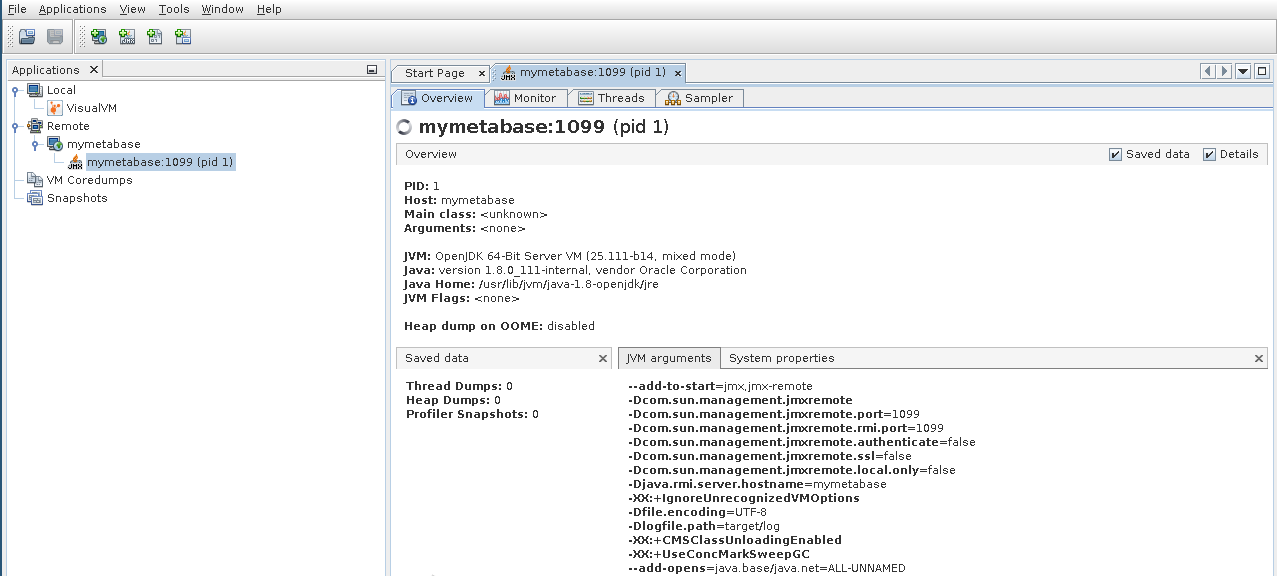
Runtime information
Connecting to a running Metabase with VisualVM makes a lot of runtime information available. Here are some highlights:
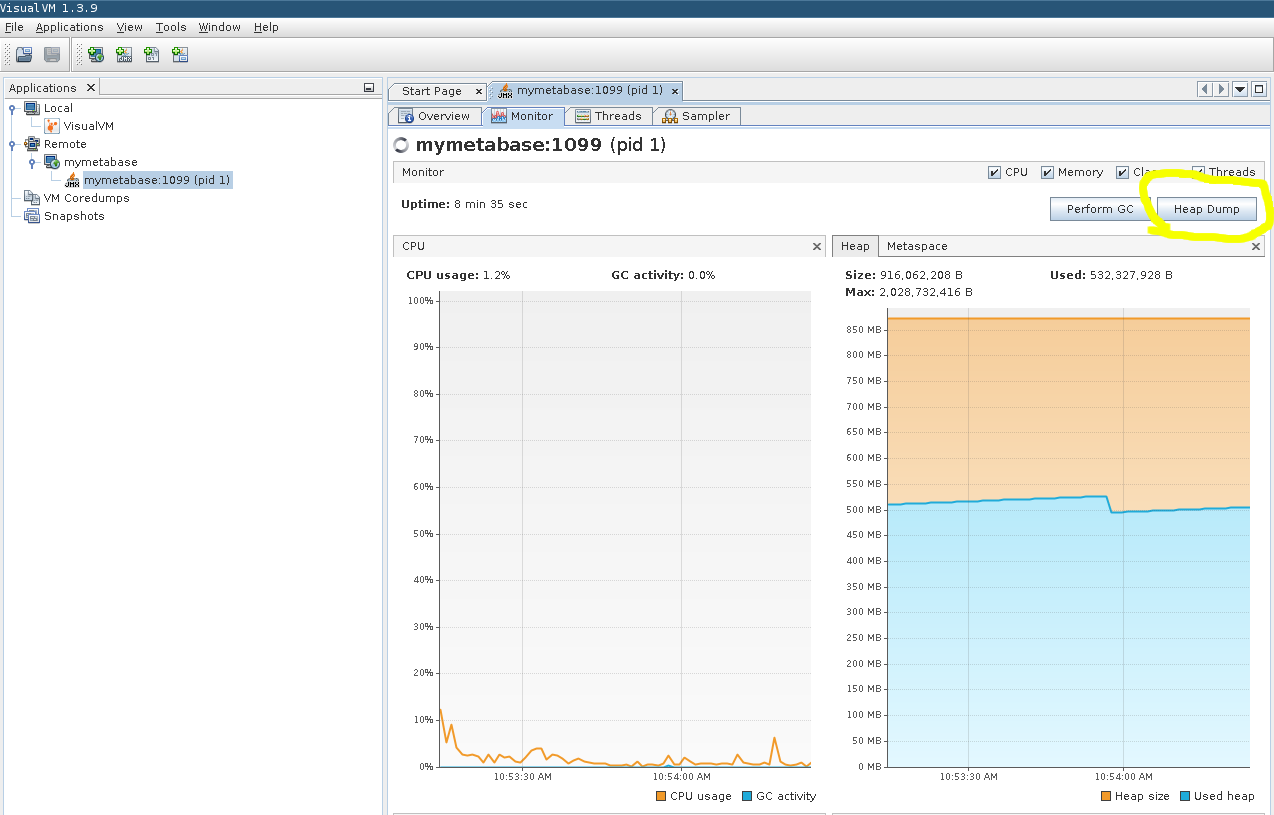
Heap dump
When running into memory-related issues, typically the first question to ask is: what is consuming extra memory? A heap dump will take a snapshot of everything in memory at that specific point of time. That memory snapshot can be analyzed later by tools like the Eclipse Memory Analyzer Tool. Create a heap dump from the “Monitor” tab:
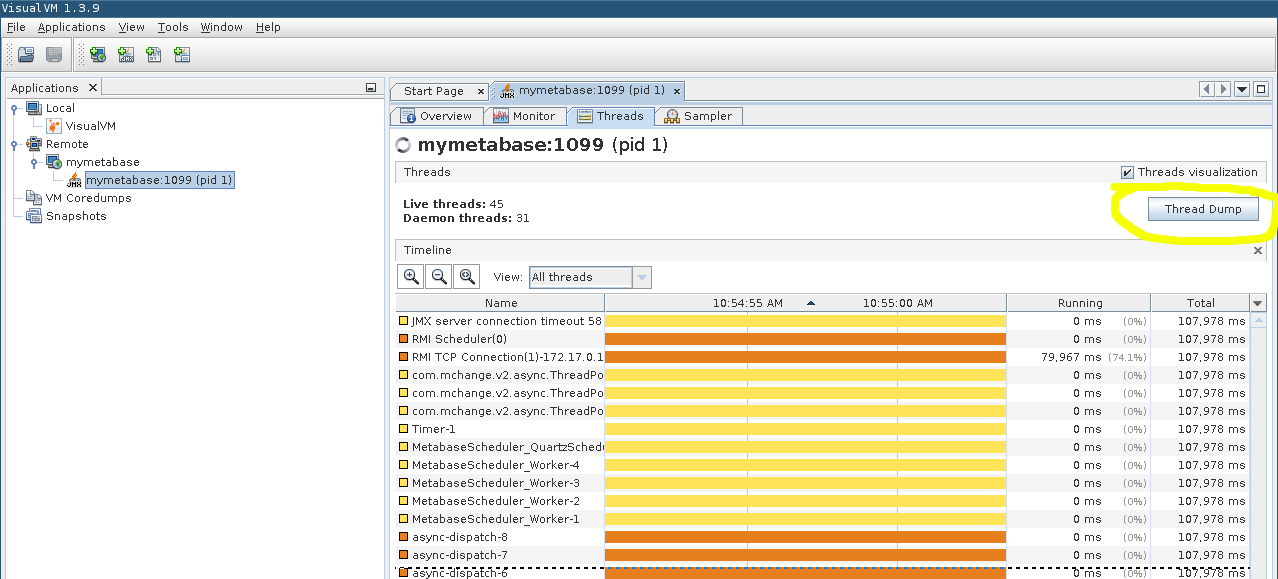
Thread dump
Another useful picture of a running Metabase system is a Thread Dump. In cases when Metabase appears stalled or slow, a thread dump will indicate what each thread is executing (or blocked on) for that specific point in time Collect a thread dump via the “Threads” tab:
Further reading
Read docs for other versions of Metabase.