

These are the docs for the Metabase master branch. Some features documented here may not yet be available in the current release. Check out the docs for the current stable version, Metabase v0.61.
Introduction to dashboards
What is a dashboard?
Dashboards group a set of questions into tabs on a single page. You can think of dashboards as shareable reports that feature a set of related questions. You can set up subscriptions to dashboards via email or Slack to receive the exported results of the dashboard’s questions.
A dashboard comprises a set of cards arranged on a grid. These cards can be:
- Questions. You can add questions from collections, or saved questions directly to a dashboard.
- Text and header cards
- Iframe cards
- Link cards
You can add filter widgets to dashboards that filter data identically across multiple questions, and customize what happens when people click on a chart or a table.
You can make as many dashboards as you want. Go nuts.
Example dashboard
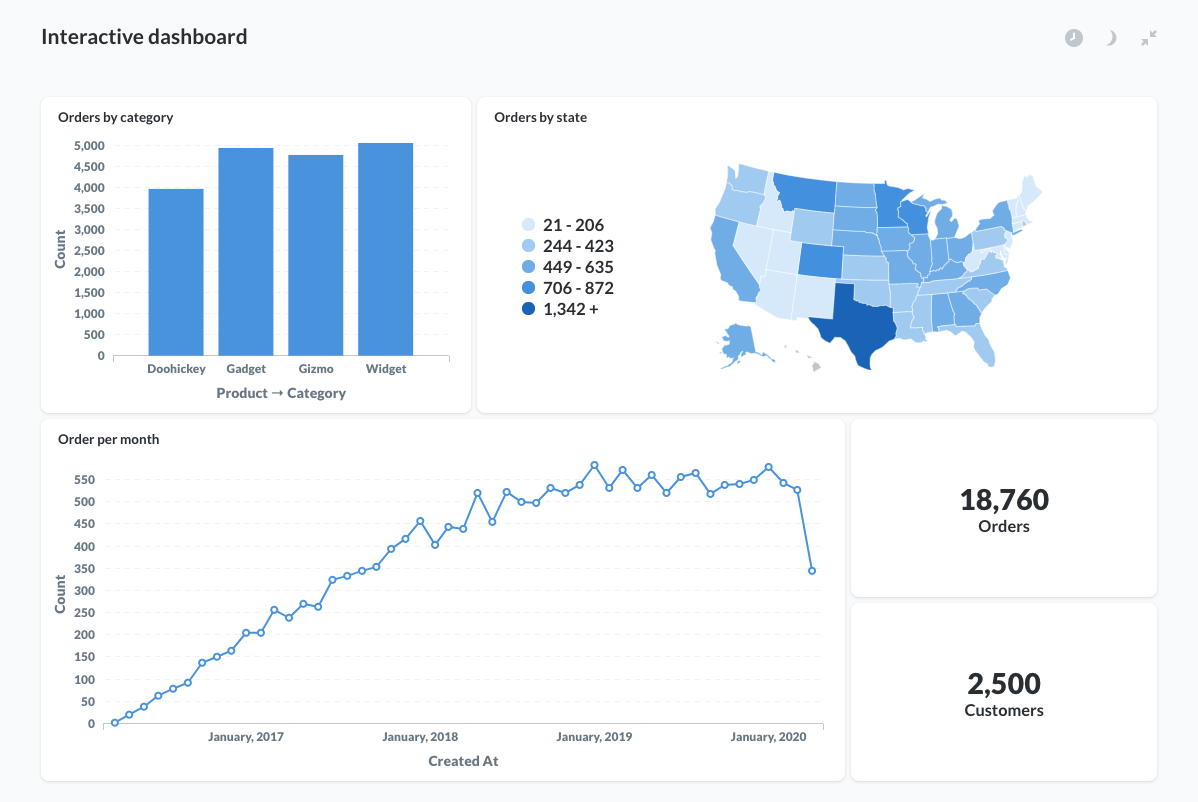
Every new Metabase comes with an example dashboard, E-commerce insights, in the Examples collection (though your admin can turn off or delete the examples). The example dashboard is yours to explore and play with.
How to create a dashboard
- In the top right of the screen, click the + New > Dashboard.
- Give your new dashboard a name and a description.
- Choose which collections the dashboard should go in.
- Click Create, and Metabase will take you to your shiny new dashboard.
- Next, you’ll need to add some questions (charts) to the dashboard, see Adding or saving questions to the dashboard.
Adding or saving questions to a dashboard
To get some charts on a dashboard, you’ll need to create questions (Metabase word for chart or query) and then add them, to the dashboard.
You can add questions that are saved to collections, or save questions directly to a dashboard.
From a dashboard
When editing a dashboard, you can add a question by clicking the + icon in the top right. You can add a chart from a new question, SQL/native query, or an existing question.
You can’t add questions that are saved to other dashboards. If you want to add a question to multiple dashboards, you should save that question to a collection. Alternatively, if the questions don’t need to stay in sync, you could duplicate a question, and save that duplicate to your dashboard. Just keep in mind that changes to one question won’t affect the duplicate question.
From a question
When creating or editing a question, you can save the question directly to a dashboard. That question can only be used by that dashboard.
Adding a question saved to a collection
To add a question saved to a collection to a dashboard, visit the question and click on the three-dot menu (…) at the top right and select Add to dashboard. You can also browse questions from dashboard edit mode.
Adding a question to a dashboard does not save the question to the dashboard.
If a question is saved to your personal collection, you’ll only be able to add that question to dashboards in your personal collection. If you want to add the question to a dashboard in a public collection, you’ll need to move your question out of your personal collection.
Adding headings or descriptions with text cards
Another neat thing you can do is add heading and text cards to your dashboards. Text cards allow you to include descriptions, explanations, notes, or even images and GIFs to your dashboards. You can also use text cards to create separations between sections of charts in your dashboards, or include links to other dashboards, questions, or websites.
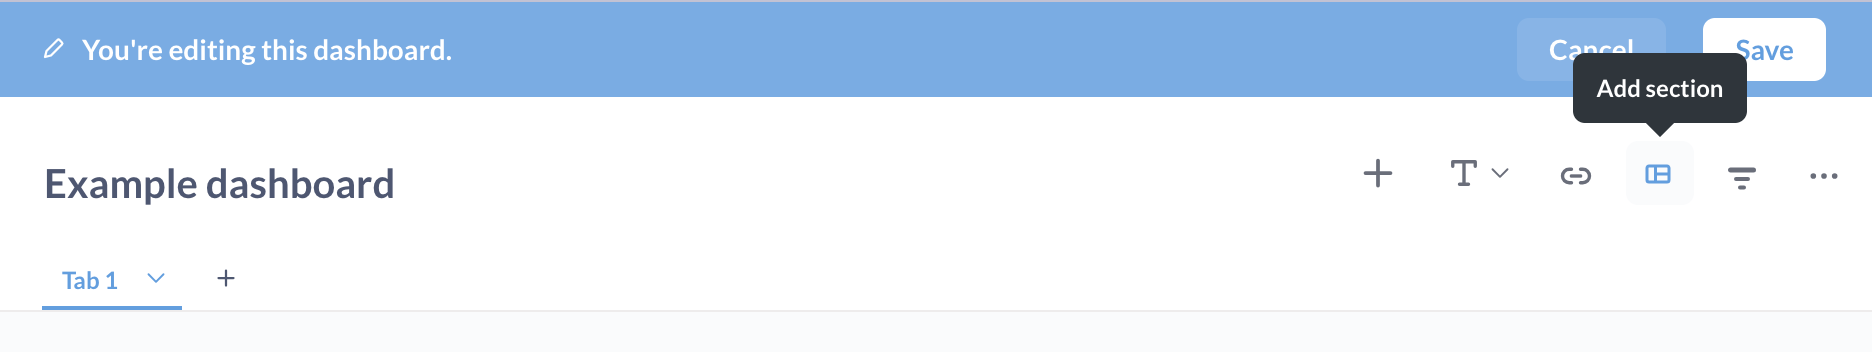
To add a new text card, create a new dashboard (or edit an existing one) and click on the text card button, T, in the top-right:
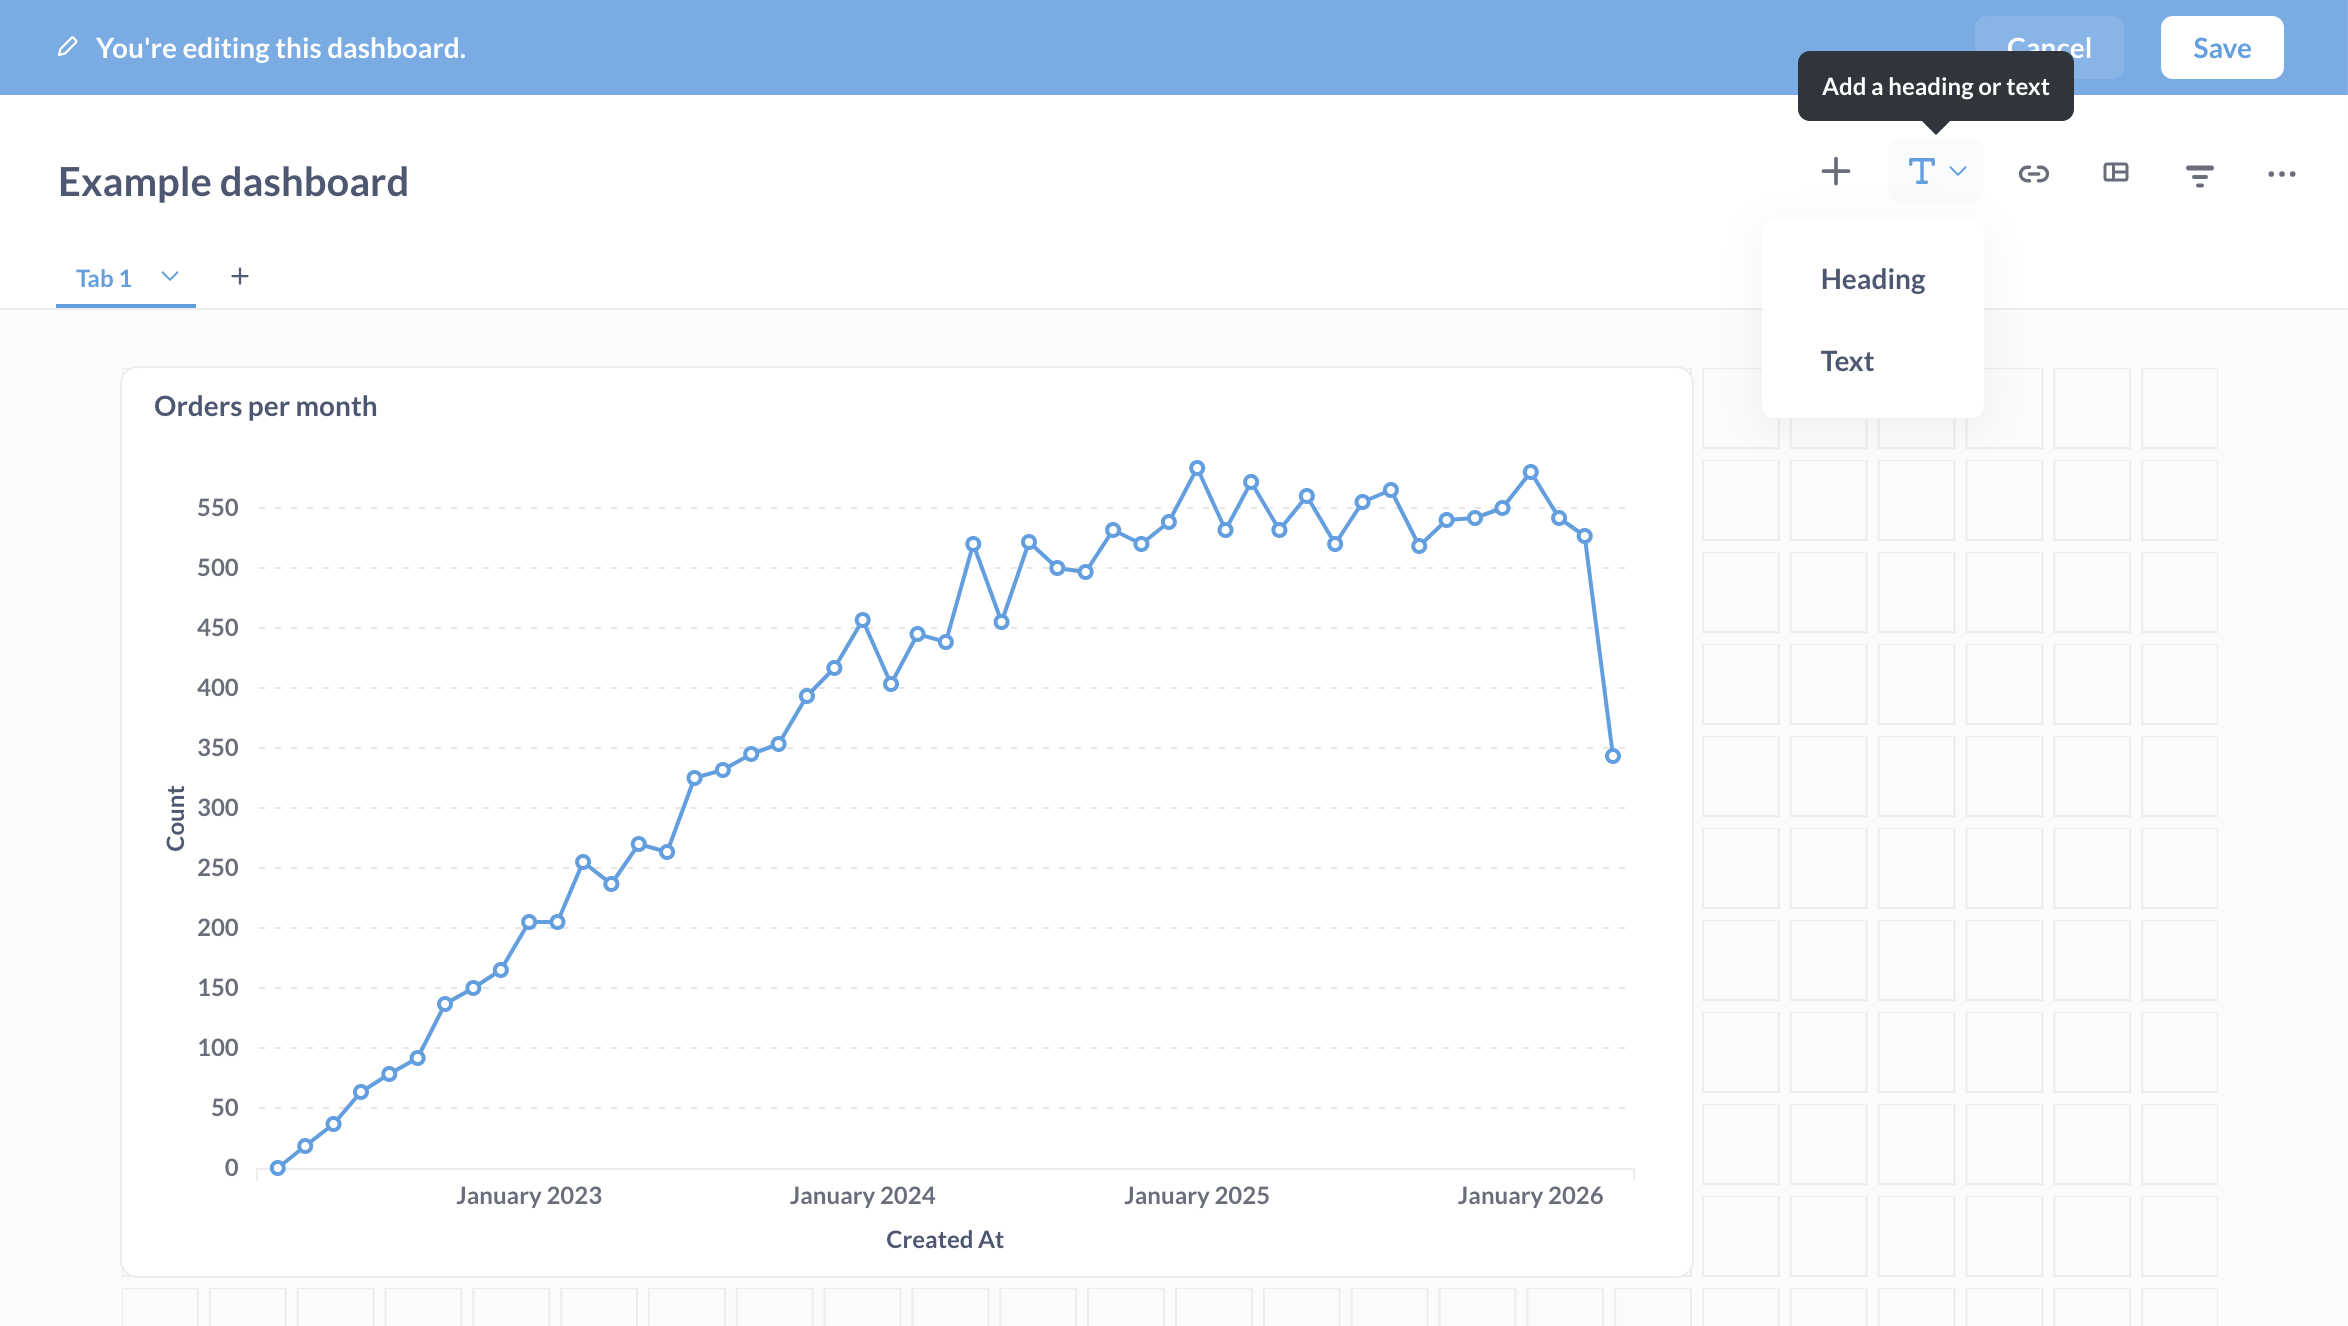
You have two options:
- Heading: a preformatted heading text card that spans the width of the dashboard.
- Text: a customizable text card that will render Markdown-formatted text.
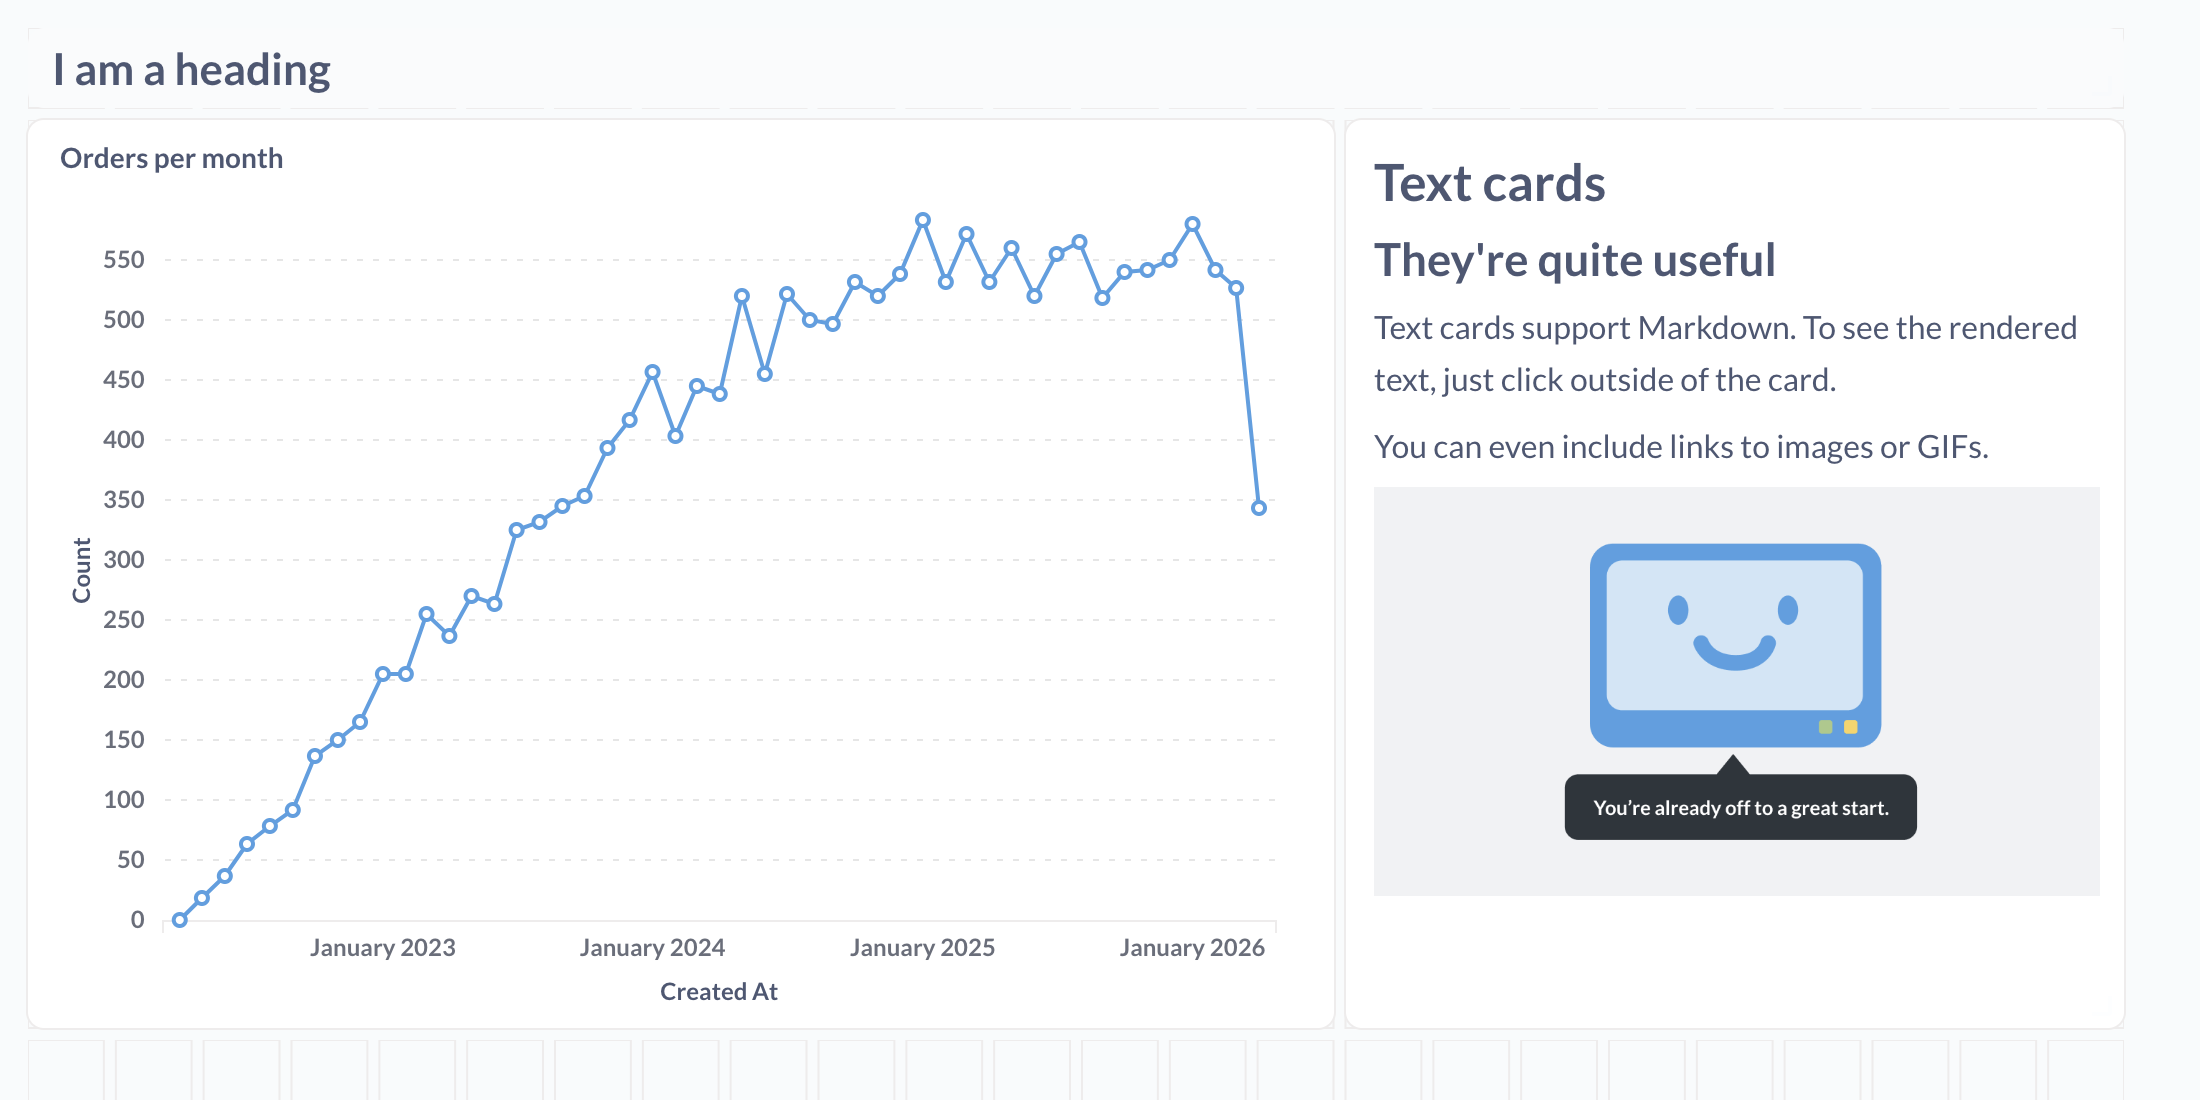
Each text card has two modes: writing and previewing. When you click to focus on the card, the card will enter editing mode. When you click away from the card, Metabase will render the card to show you what it will look like on the live dashboard.
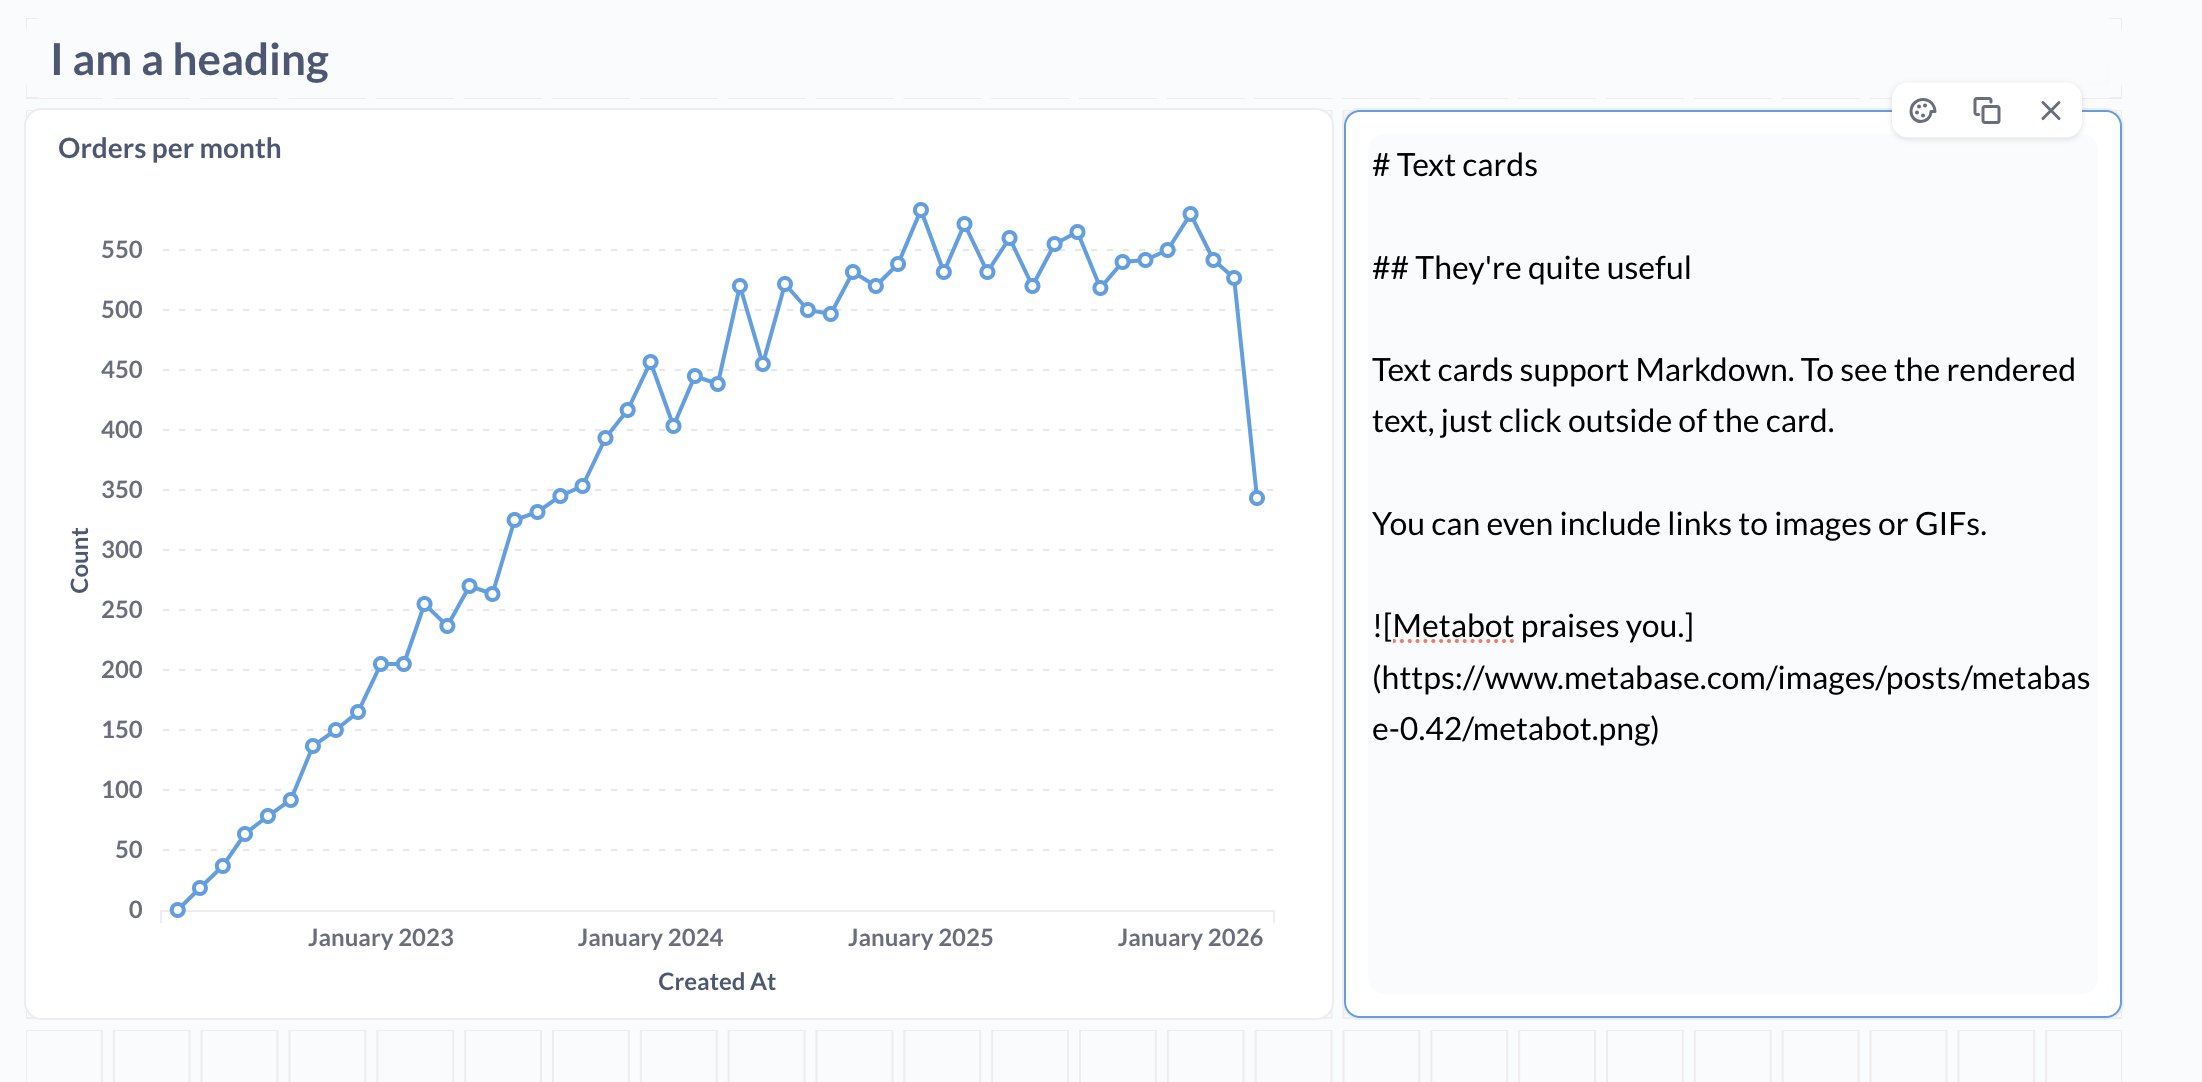
You can use Markdown to format the text in your text card, create inline tables or code snippets, or even embed linked images (easy on the GIFs, friends). To preview the rendered card, just click away from the card.
To learn more, see Fun with Markdown in your dashboards.
Including variables in text cards
You can include a variable in a text card, then wire that variable up to a dashboard filter. All you need to do to create a variable is to wrap a word in double braces, {{ and }} (the variable can’t contain any spaces). For example, you could add a text card with the following text:
# {{state}} orders
And connect that variable to a dashboard filter widget that filters for states. If someone selected WI in the state filter, the text in the markdown card would read: WI orders.
You can also make text optional by wrapping the text in double brackets, [[ and ]]:
# Orders [[from {{state}}]
In this case, the phrase from {{state}} would only display if someone selected a value (or values) in the filter widget.
To see how to wire up a filter to a card, see dashboard filters.
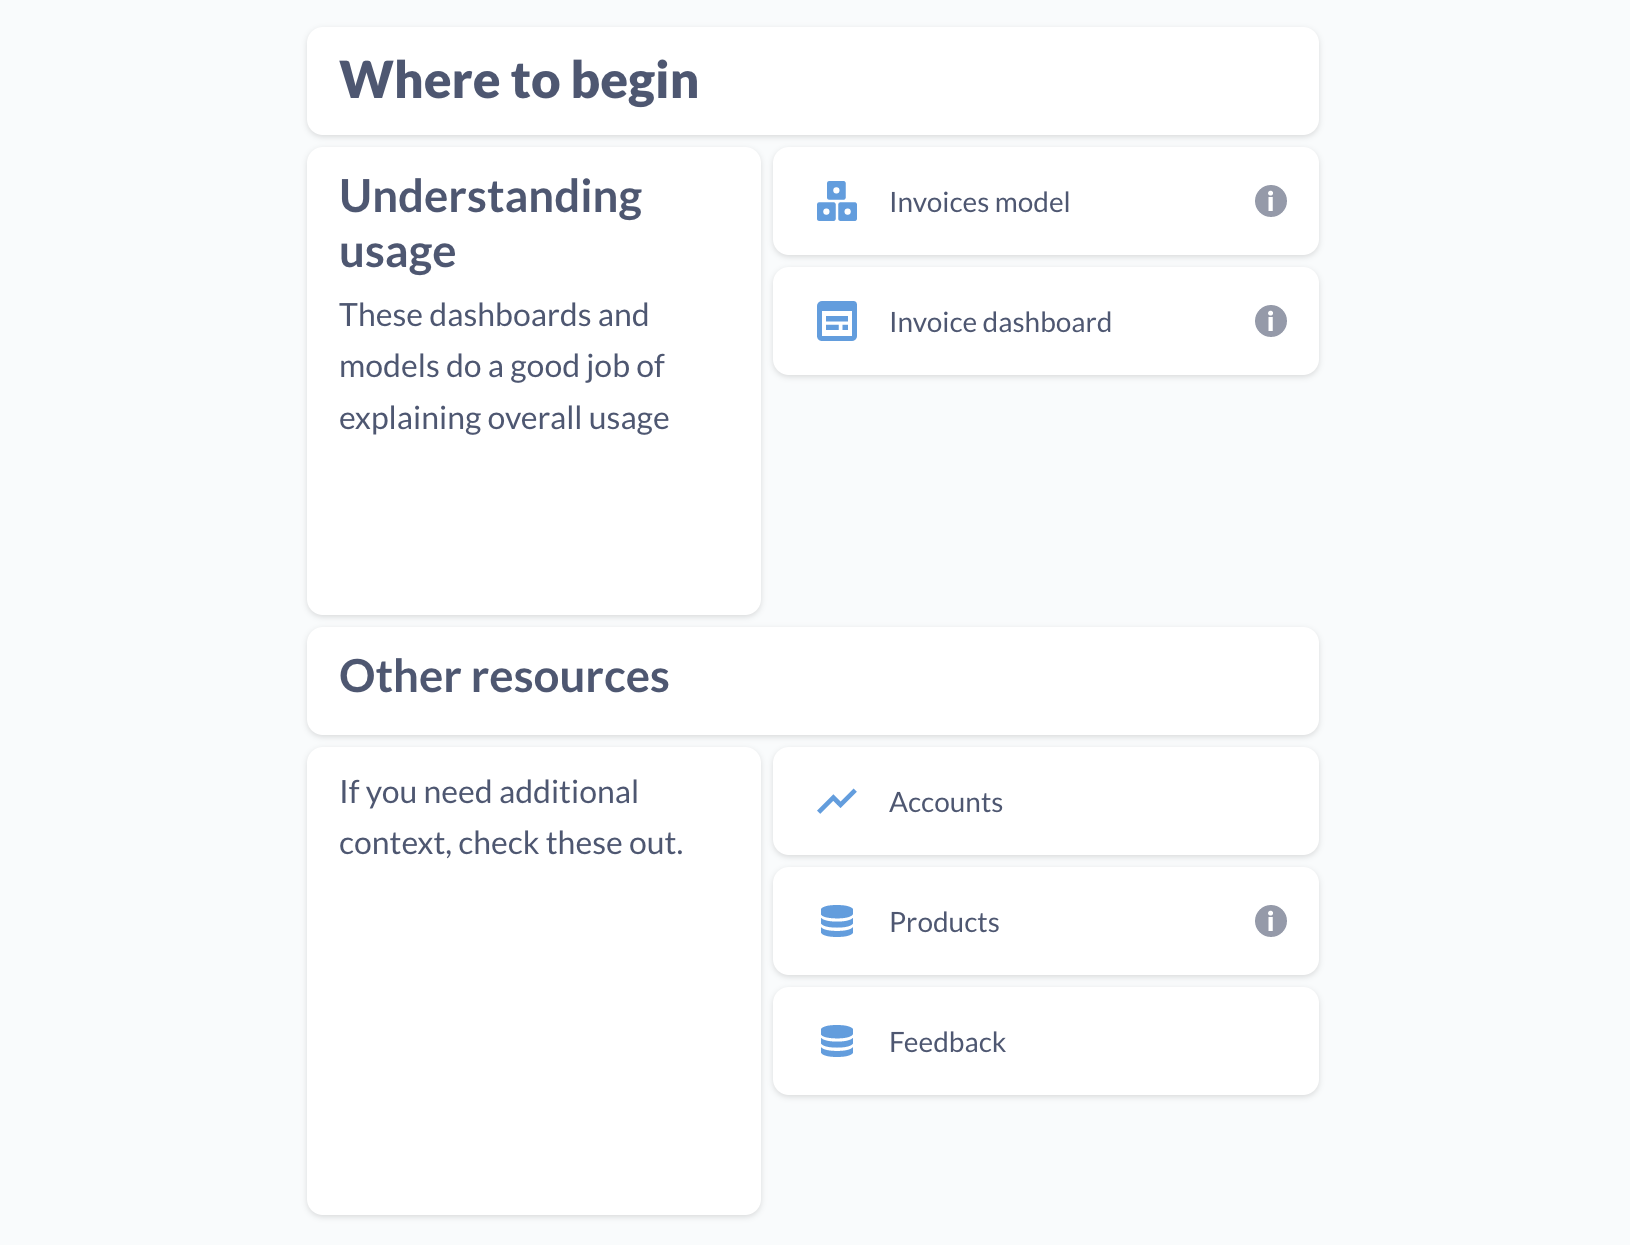
Link cards
Link cards are specialized cards that let you search and link to other items in your Metabase. You can also use them for external links. Useful for pointing people to other resources relevant to your dashboard.
To add a link card to a dashboard:
- When viewing a dashboard, click the pencil icon to enter dashboard editing mode;
- Click the link (paper clip) icon to add a link card.
- On the link card, click the input field to search your Metabase for an item to link to, or paste an external link.
Link cards support variables so you can use dashboard filters to update values in the link card’s URL. For example, you could include a variable in a URL using double braces, like so:
https://www.example.com/{{path}}
To provide values for the variable, you’ll need to add a filter to the dashboard, and connect that filter to the card’s variable (in this case path). Parameters are only supported for non-Metabase URLs (that is, URLs that you manually enter, not URLs you search and select from your Metabase). You can optionally set a default value for the variable. See Connecting a filter or parameter widget to dashboard cards.
Iframe cards
Iframes allow you to nest one HTML page in another HTML page. With iframe cards in Metabase, you can embed a webpage in your dashboard. You can embed:
- Spreadsheets or surveys for data entry or workflows
- Videos or slides for contextualizing and storytelling on dashboards
- Live charts and visualizations from other tools
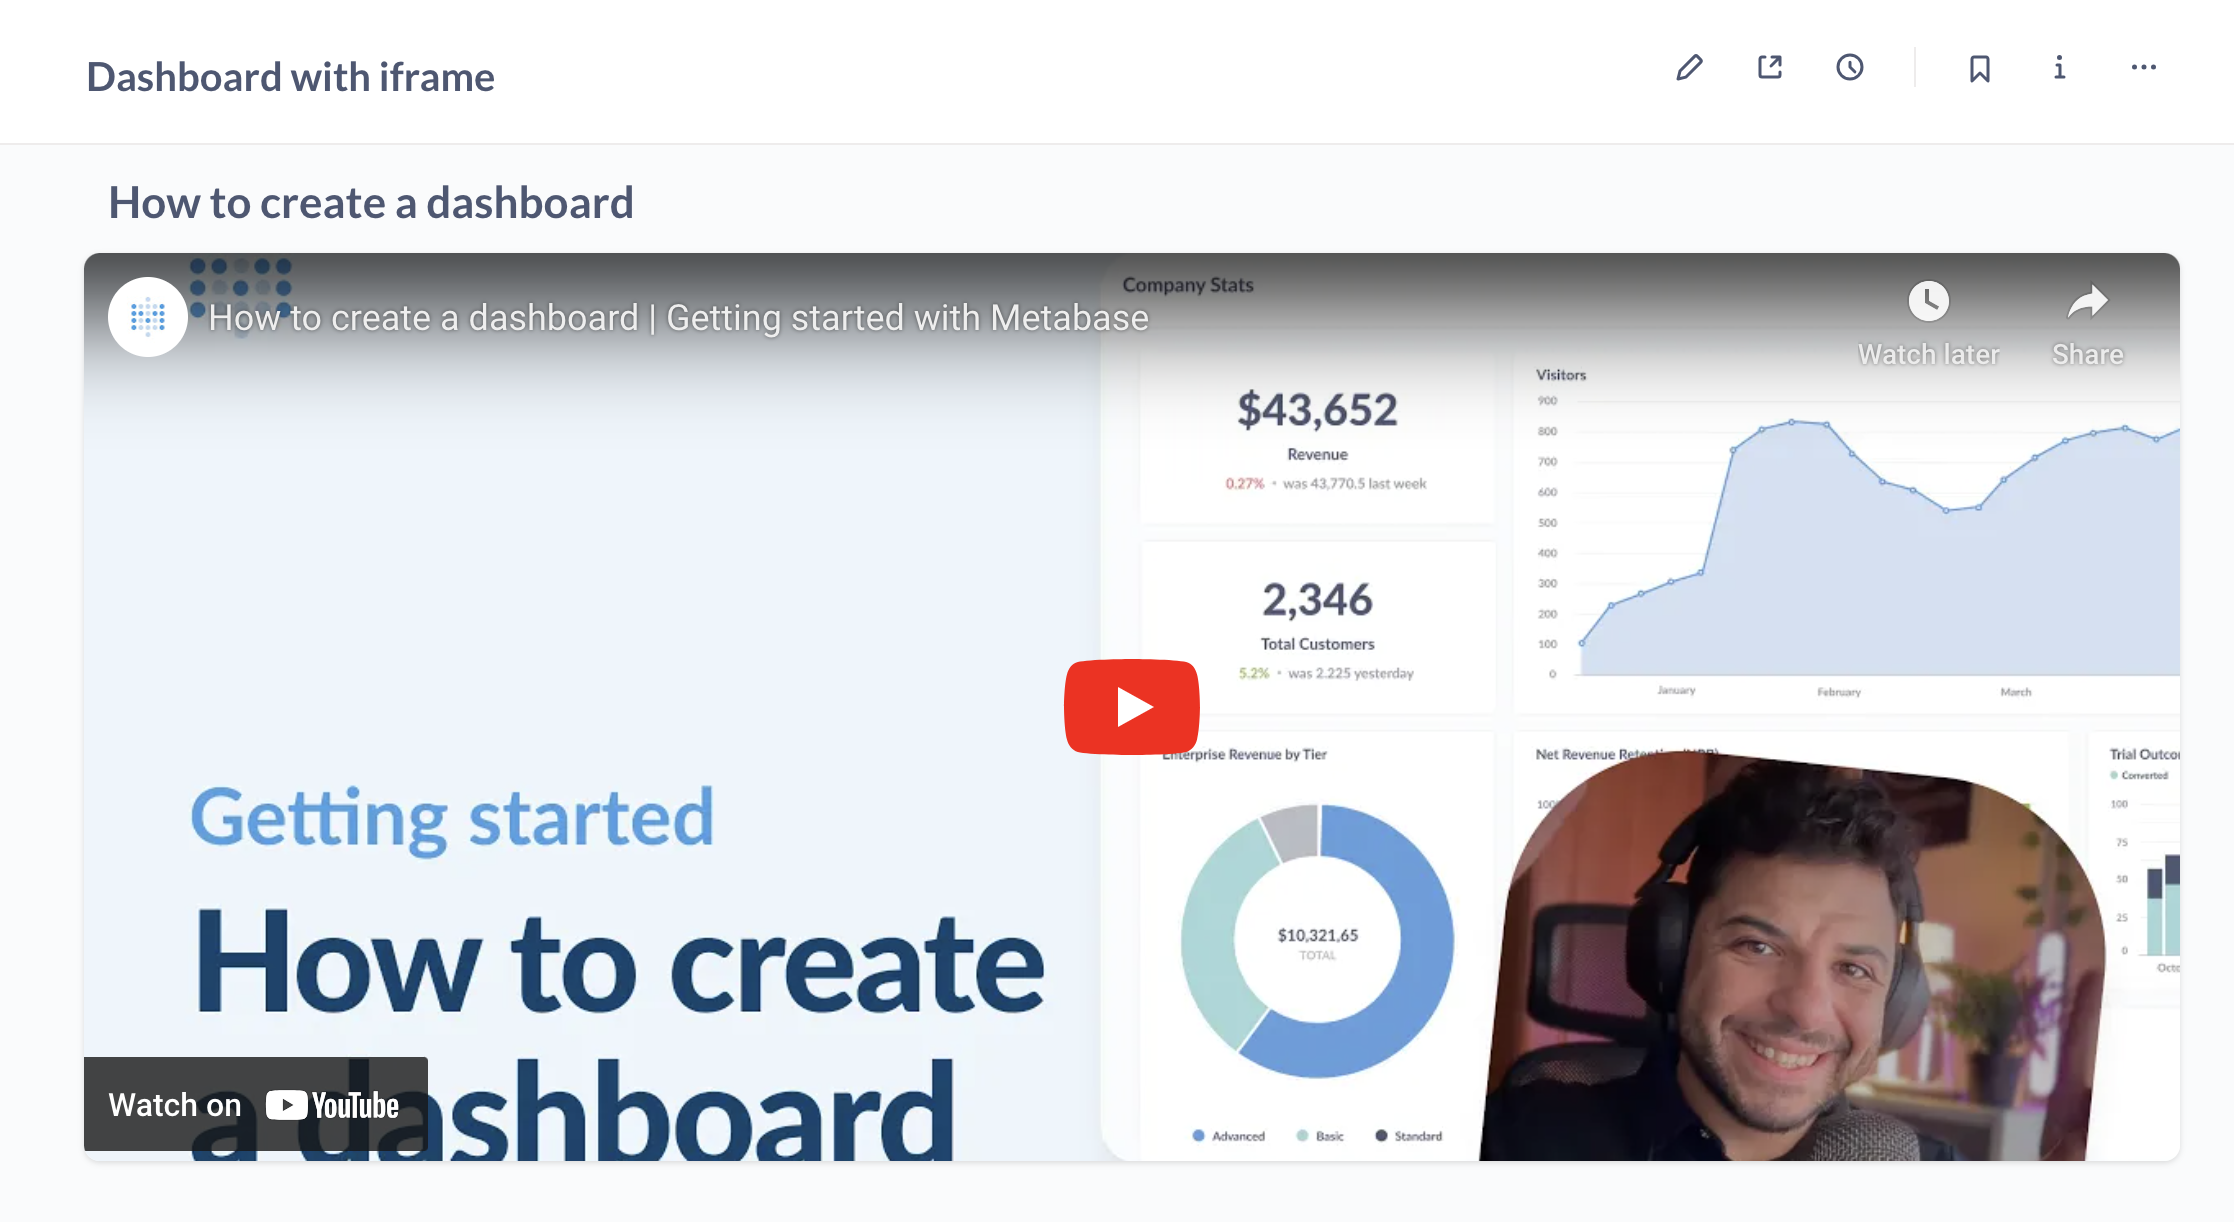
To add an iframe card to a dashboard, click the pencil icon to enter dashboard editing mode, then click on the link icon and select Iframe. Then paste the iframe URL. Here’s an iframe for our video on how to create a dashboard:
<iframe
  width="560"
  height="315"
  src="https://www.youtube.com/embed/W-i9E5_Wjmw?si=qWeMGxEymVOIHiXo"
  title="YouTube video player"
  frameborder="0"
  allow="accelerometer; autoplay; clipboard-write; encrypted-media; gyroscope; picture-in-picture; web-share"
  referrerpolicy="strict-origin-when-cross-origin"
  allowfullscreen
></iframe>
And behold, a dashboard with an embedded video:
Iframe cards support variables so that you can use a filter widget to update values in the iframe. For example, you could include a variable in the iframe’s src URL with double braces, like so:
src="https://www.youtube.com/embed/{{video_id}}
To provide values for the variable, you’ll need to add a filter to the dashboard, and connect that filter to the card’s variable (in this case video_id). You can optionally set a default value for the variable. See Connecting a filter or parameter widget to dashboard cards.
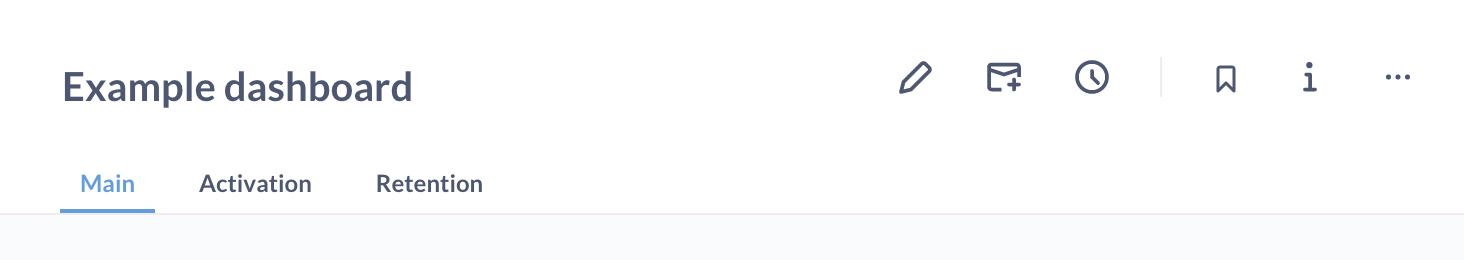
Dashboard tabs
You can add multiple tabs to a dashboard to keep your cards organized.
Duplicate a tab
When in dashboard edit mode, you can duplicate a tab and all its cards by clicking on the down arrow next to the tab that you want to copy.
Moving cards between tabs
See Arranging cards.
Duplicating a dashboard
If you don’t want to build a dashboard from scratch, or want to experiment by making changes to an existing dashboard without affecting the original, you can duplicate an existing dashboard.
To duplicate a dashboard, click on the … menu in the upper right of the dashboard, and select Duplicate.
By default, Metabase will create a new dashboard, with copies of the questions in the original dashboard (including the dashboard’s tabs). Metabase will save the duplicated questions either to the target collection, or to the duplicated dashboard, depending on where the original questions were saved.
Duplication only includes the dashboard, its card layout, filters, and (optionally) the questions. What’s not copied: dashboard subscriptions, actions, or any sharing or embedding data settings. For example, if you copy a dashboard that has been made public, that copied dashboard will not be public by default.
Arranging dashboard cards
To edit dashboard cards and move them around, click the pencil icon in the top right of a dashboard to enter the dashboard’s editing interface.
Moving cards around
Once you’re in edit mode, you’ll see a grid appear. You can move and resize the cards in the dashboard to your liking and they’ll snap to the grid.
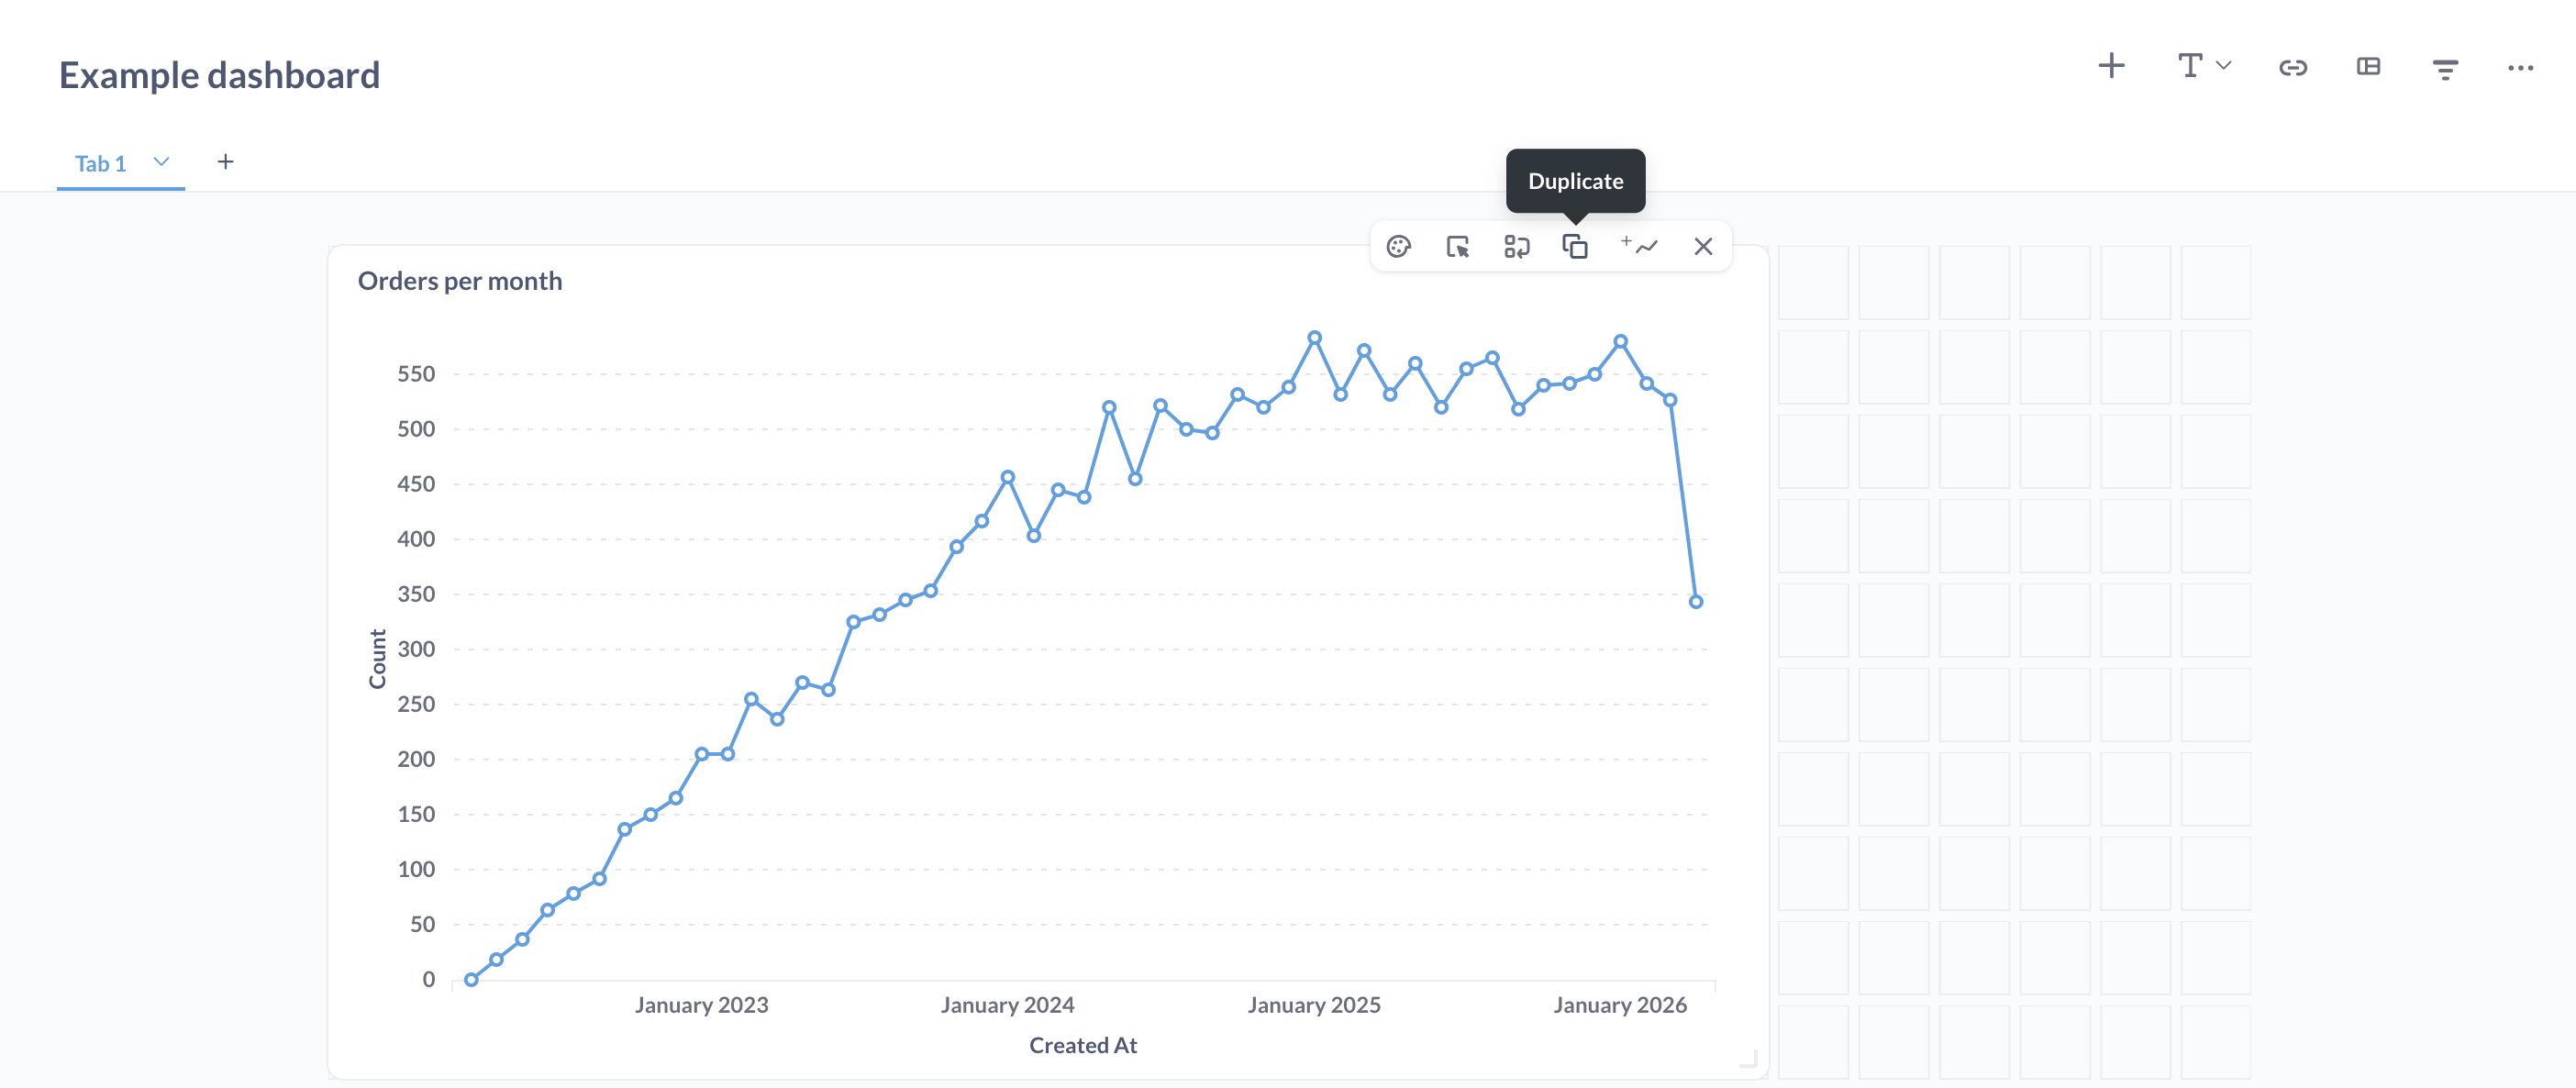
- Duplicate a card: hover over the card and click the Duplicate icon.
- Move a card to a new tab: hover over the card, click the move icon, and select that tab you want to move the card to.
- Move a card within a tab: click and drag the card. Other cards will move out of the way.
- Resize a card: click the handle at the bottom right corner of the card, and drag to resize. Nearby cards will move away to accommodate the new size.
- Remove a card: hover over the card and click the X icon in the top right corner.
- Replace a card: hover over the card and click the Replace icon in the top right corner. Search for a question to swap in for the existing question on that card. You can only replace a question with another question, not another type of card (like a text card).
Metabase will automatically update a question’s display to make sure your data looks great at any size you choose.
To edit the cards themselves, see Editing dashboard cards.
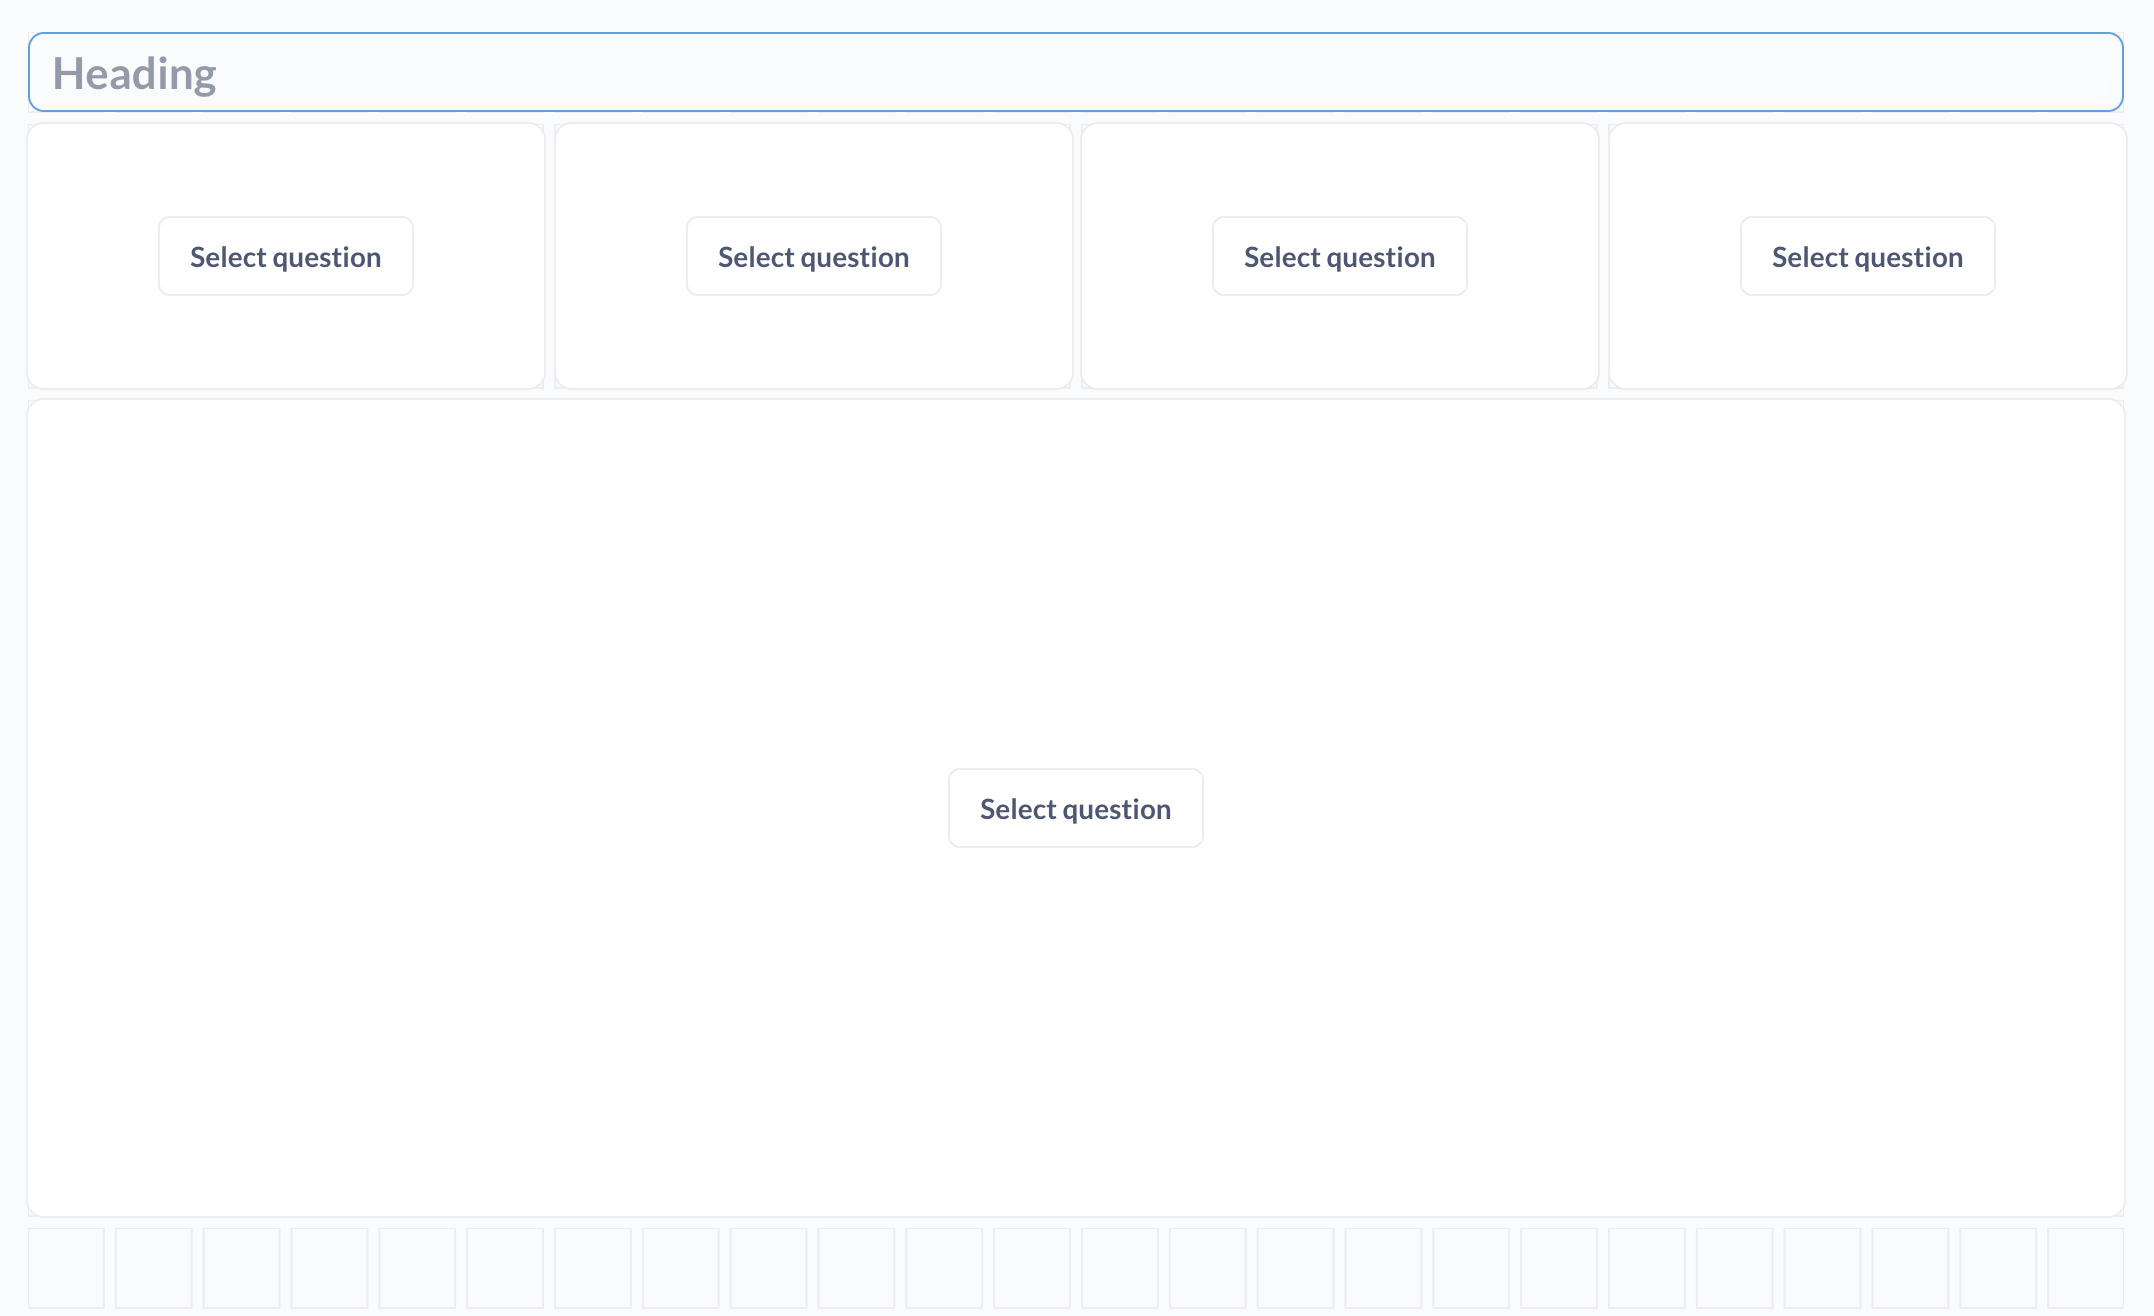
Dashboard sections
To speed up card arrangement, you can add sections to your dashboards.
Sections are templates with headings and pre-arranged cards. Once you add a section to a dashboard, you can pick questions for each card, and make any other changes you like. You can only pick questions for cards, not another type of card (like a text card).
If you forget to set a question for a card, the dashboard will simply render a blank card.
Sections include:
KPI Grid
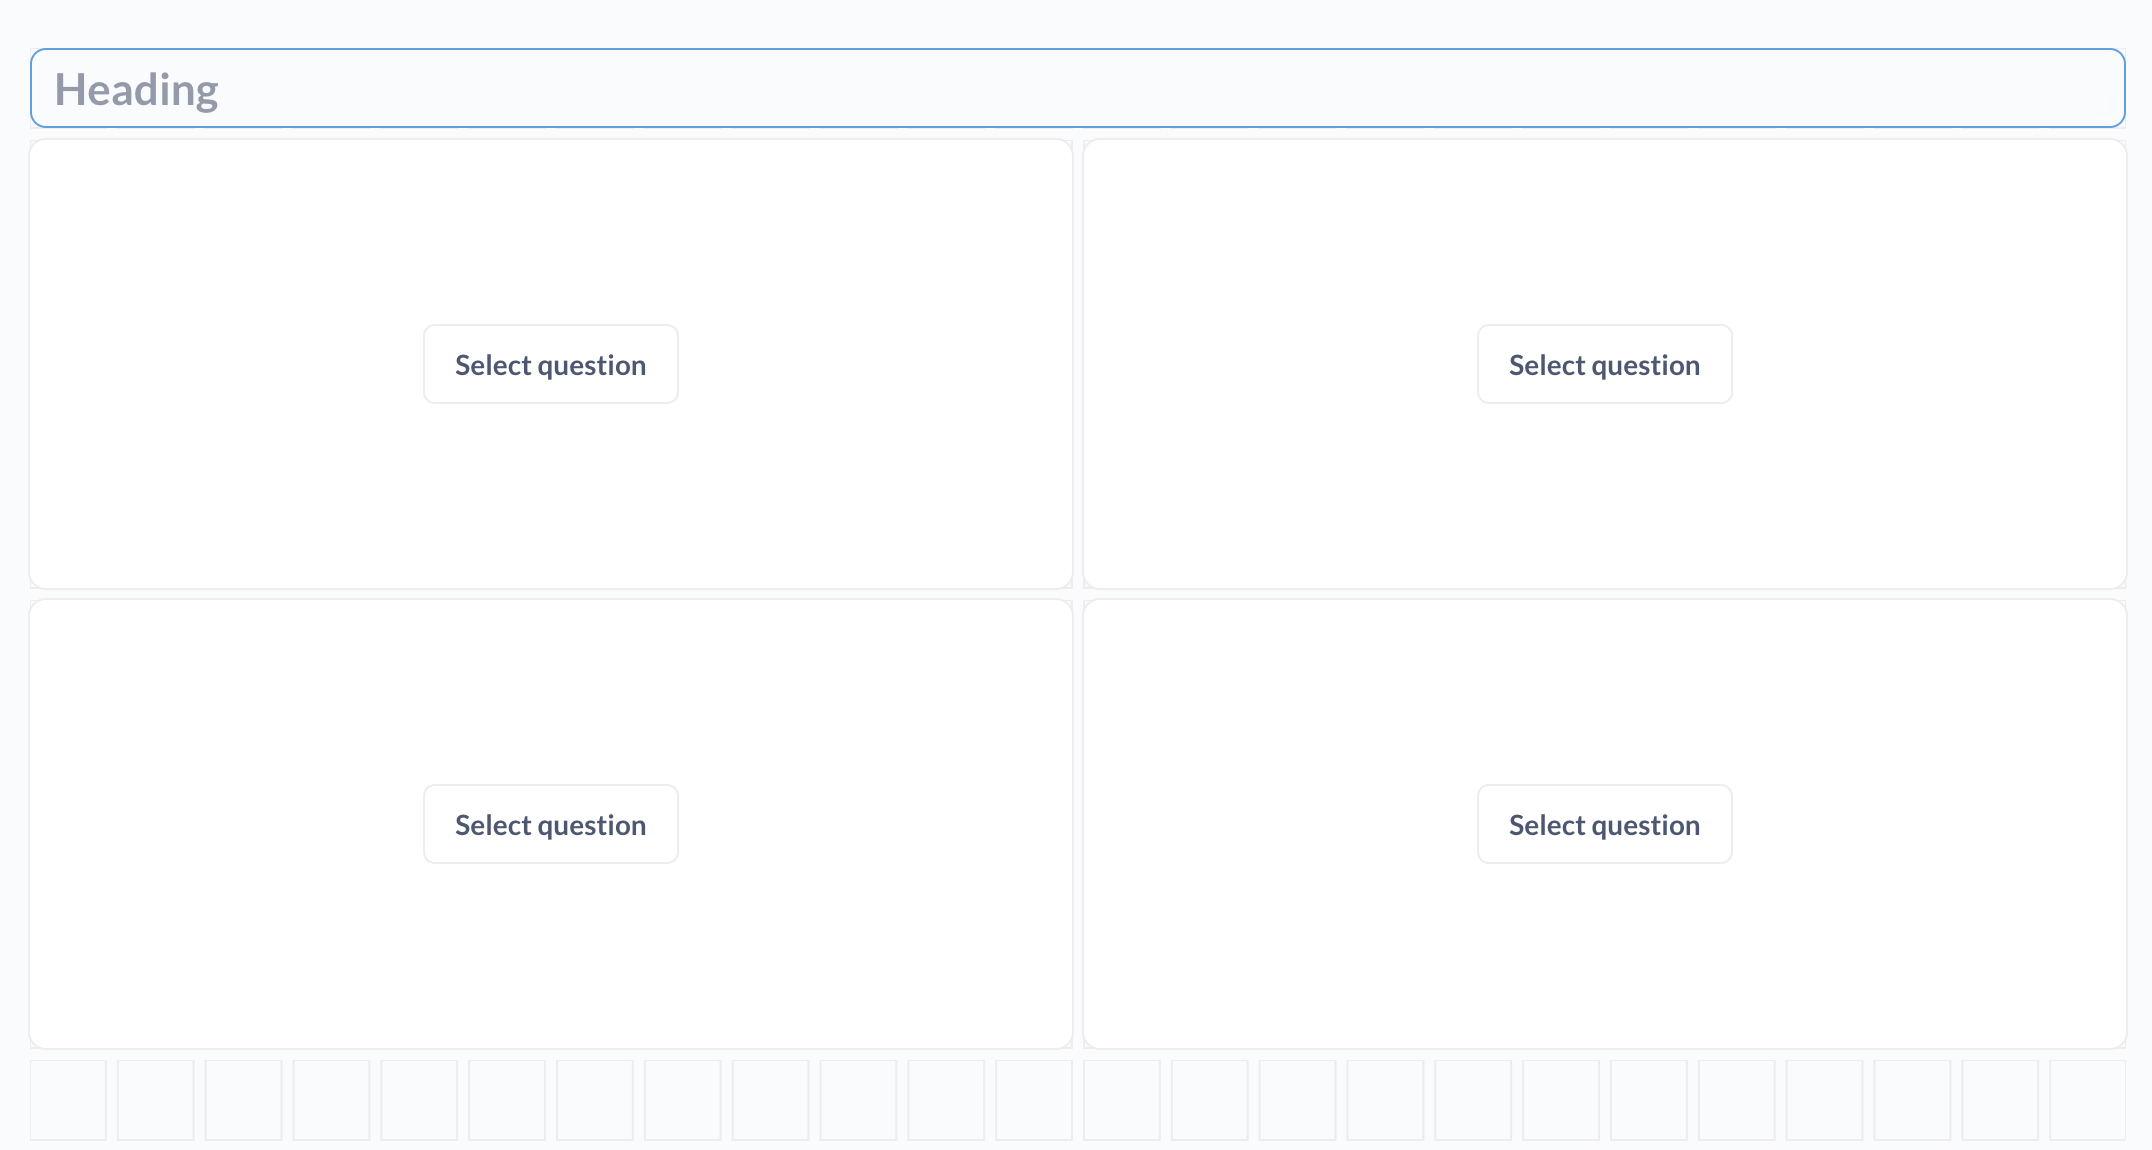
Large chart with KPIs to the right
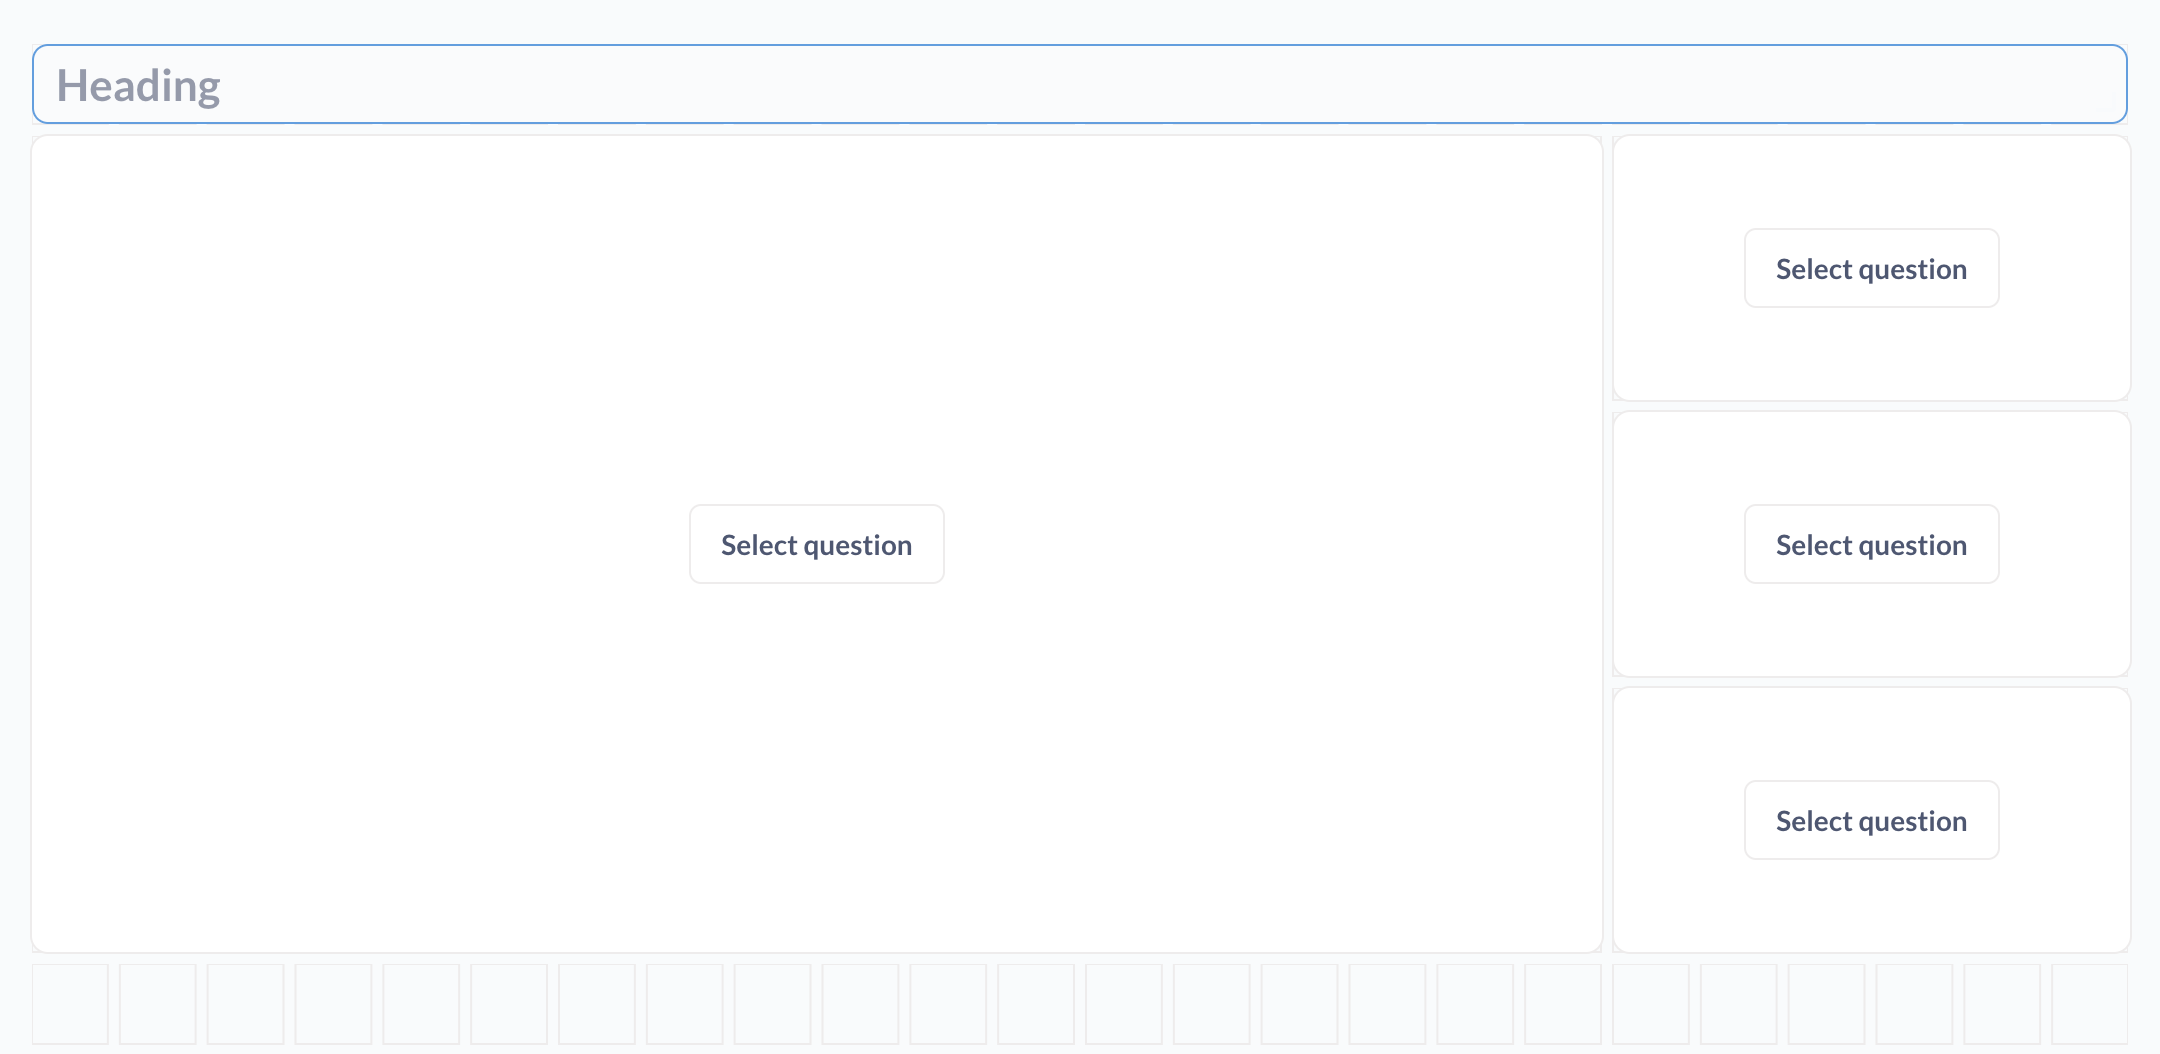
KPIs with large chart below
Dashboard width
You can change the width of a dashboard by going into the three dots menu in the upper right:
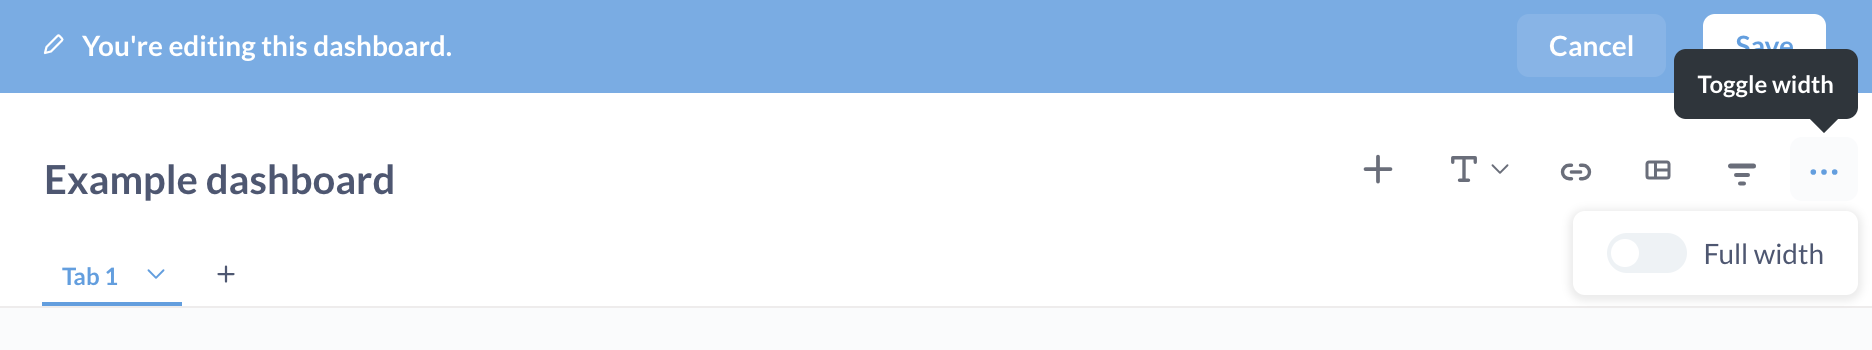
- Fixed width (default). Metabase will restrict the layout to a fixed width in the center of the screen. This fixed width can keep dashboard layouts consistent between smaller laptop screens and larger desktop screens.
- Full width. The layout and cards will expand to take up the full width of the screen.
Editing dashboard cards
To edit a card’s:
- Underlying query: click on the card’s title while not in dashboard editing mode. If the card displays multiple questions, pick the question you want to edit from the dropdown.
- Visualization settings, see changing a card’s visualization settings.
Changing a card’s visualization settings
You can change a card’s visualization settings (to add a goal line, for example). Changing a card’s visualization settings will only affect how the question appears on that dashboard card; these changes won’t affect the original question’s visualization settings.
Click on the pencil icon to enter dashboard edit mode, hover over the question you want to edit, and click on the pencil icon or palette icon (depending on the chart type) to edit a card’s visualization’s settings.
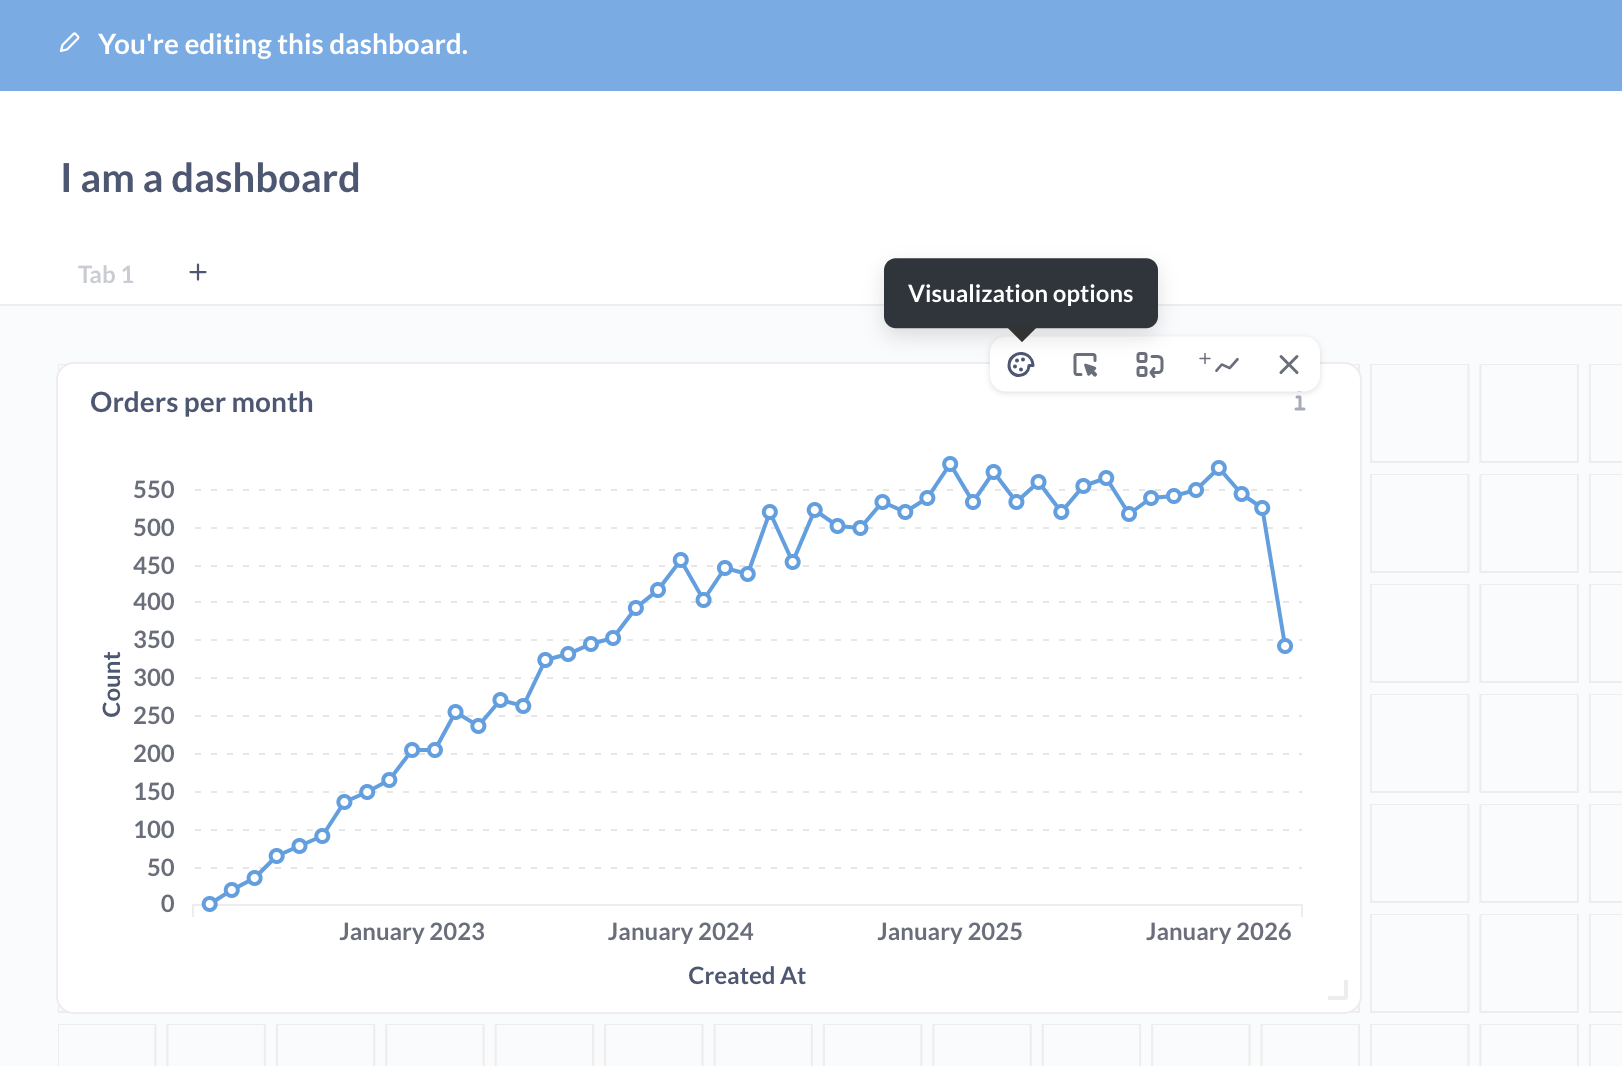
If you clicked the pencil icon, look for Settings button in the bottom right.
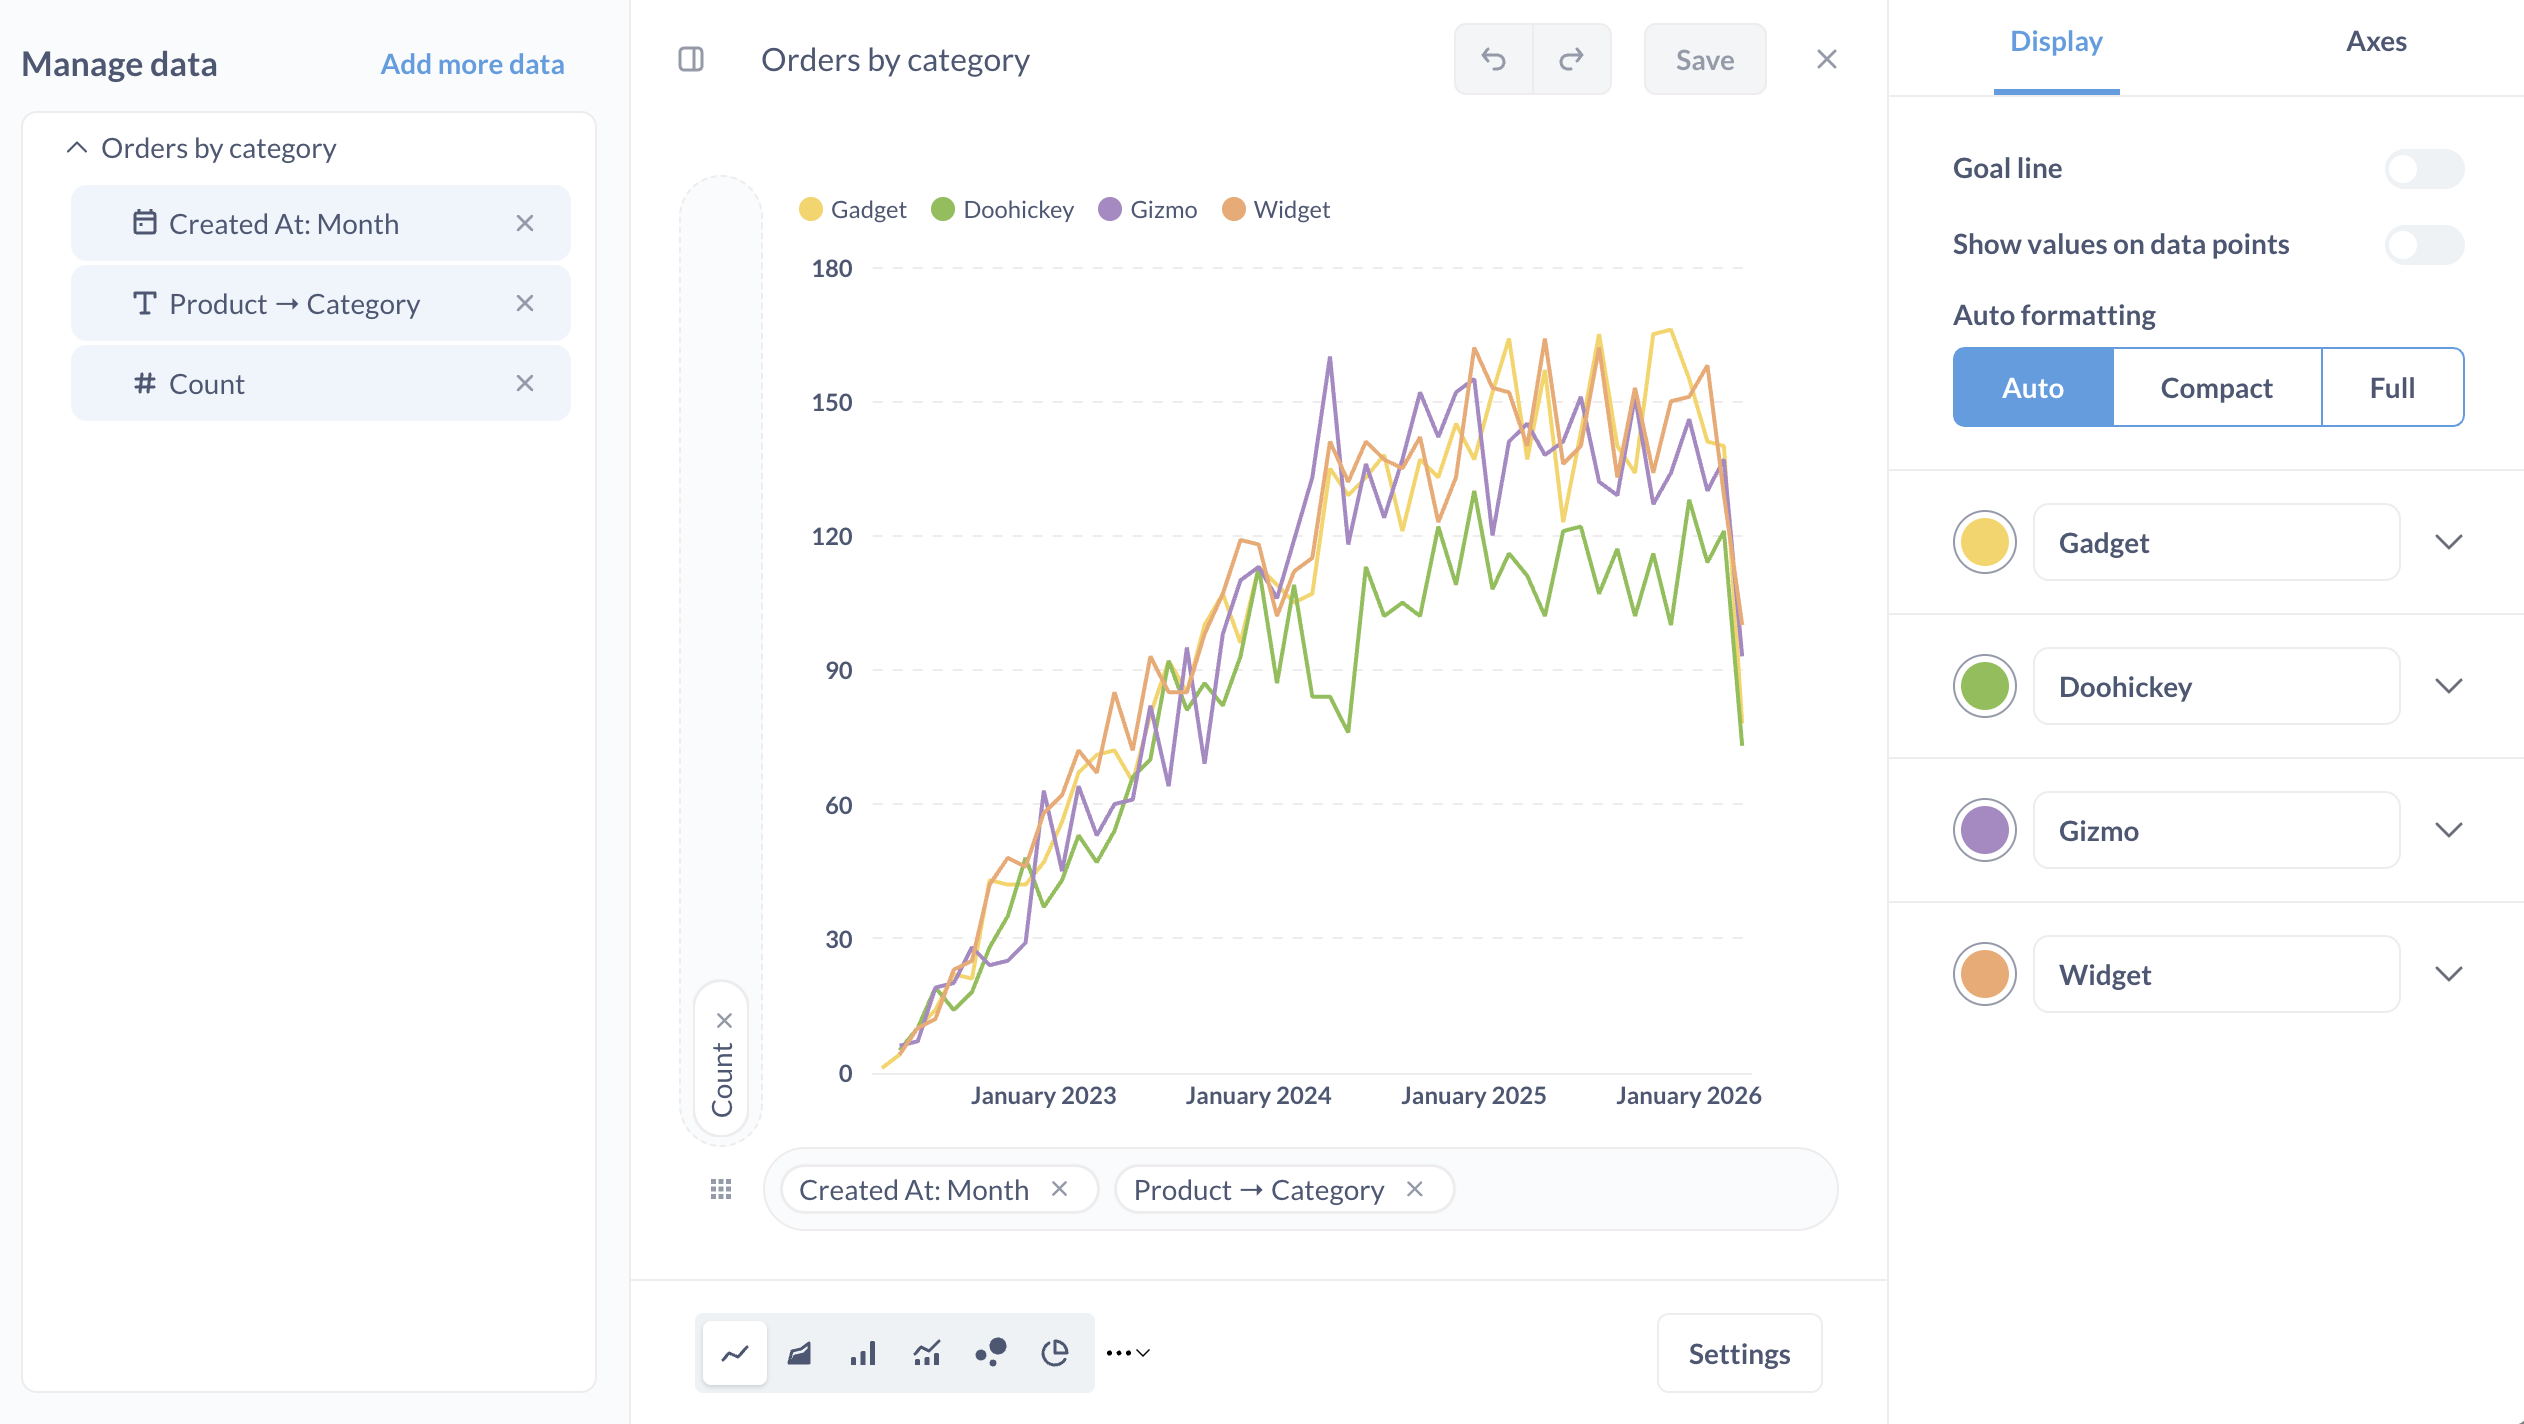
You can also add more data to the chart.
Hiding a card when it doesn’t return results
One neat thing to call out: if you have a question card that rarely returns results, but you still want to include that card in your dashboard because you want to know when the question does return results, you can tell Metabase to hide the card unless it returns at least one row of data.
When in dashboard edit mode, click on the Visualization settings for the card.
- For tables, the option is in the Columns tab.
- For other charts, the option is in the Display tab.
Toggle the option Hide this card if there are no results. When you turn on this option, the query will still run in the background, but the dashboard won’t display the card. If the query returns results, the dashboard will display the card, moving the other cards around to make room for it according to how you’ve arranged the cards in dashboard edit mode.
Resetting a card’s visualization settings
If you want to revert a dashboard card to its original visualization settings (i.e., the settings on the question when it was first saved to your dashboard):
- Go to your dashboard and click the pencil icon to go into edit mode.
- Hover over the card (question) that you want to edit.
- Click the palette icon to bring up the visualization settings for that card.
- Click Reset to defaults (bottom right).
- Click Done to save the card’s visualization settings.
- Click Save to save the dashboard.
If you don’t see the palette icon, you’ll need to:
- Click the pencil icon to edit the card’s visualization settings.
- Remove the data in the Manage data section.
- Re-add the question to the card.
- Save your changes.
Fullscreen dashboards
After you’ve made your ideal dashboard, you may want to put the dashboard on a TV to help keep your team up to date throughout the day.
To enter fullscreen mode, click the fullscreen icon in the top right of the dashboard (the icon with the arrows pointing in opposite directions).
Auto refresh
If your data updates frequently, you can set up your dashboard to refresh automatically by clicking on the clock icon.
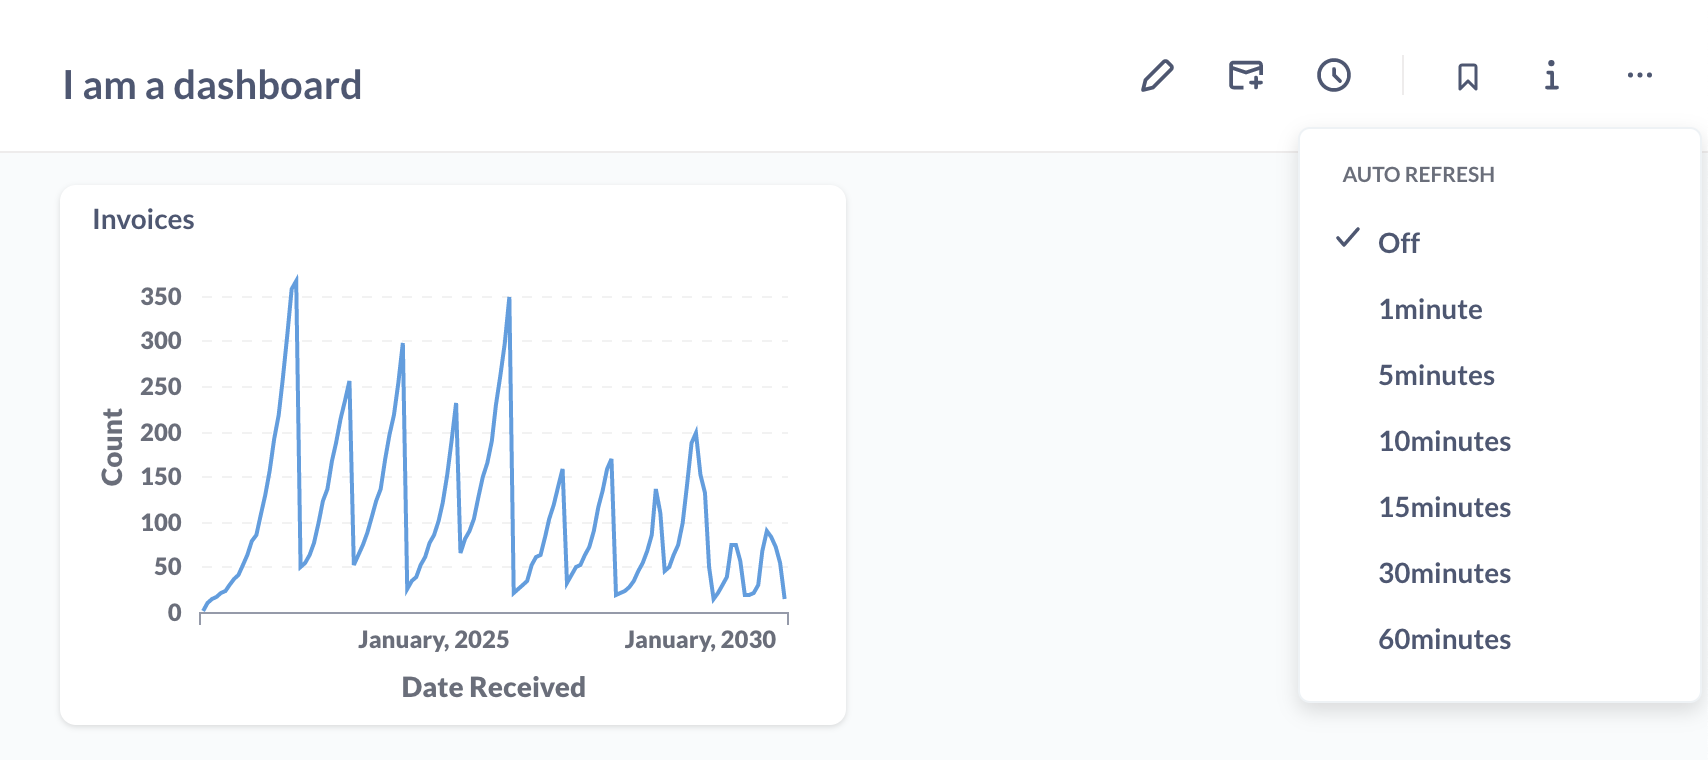
You can set your dashboard to update in 1, 5, 10, 15, 30, and 60 minute intervals, depending on how fresh you need the data to be.
Enabling auto refresh will re-run all the queries on the dashboard at the interval you choose, so keep the size of the dashboard and the complexity of the questions in mind when setting up auto refresh.
Combining fullscreen mode and auto refresh is a great way to keep your team in sync with your data throughout the day.
Caching dashboard results
Caching dashboard results is only available on Pro and Enterprise plans (both self-hosted and on Metabase Cloud).
Sharing dashboards with public links
If your Metabase administrator has enabled public sharing on a saved question or dashboard, you can go to that question or dashboard and click on the sharing icon to find its public links.
![]()
Public links can be viewed by anyone, even if they don’t have access to Metabase. You can also use the public embedding code to embed your question or dashboard in a simple web page or blog post. Check out examples of simple apps with embedded dashboards in our embedding-reference-apps repository. To learn more about embedding, check out our article on How to use Metabase to deliver analytics to your customers, as well as an article on how to combine branding, Single Sign-On, full app embedding, and row and column security to deliver multi-tenant, self-service analytics.
Exporting results from a dashboard
You can export the entire dashboard as PDF, or export results of individual questions on the dashboard. See Exporting results.
Configuring a dashboard through its URL
You can amend the URL of a dashboard to automatically enter fullscreen or auto-refresh the dashboard. Customizing the dashboard’s URL allows you to configure the dashboard - even when you do not have any input access to the device where the dashboard will be displayed, like scripted screens, for example.
To configure a dashboard using its URL, you can add the following optional keywords:
fullscreenrefresh
Here’s an example URL:
https://metabase.mydomain.com/dash/2#refresh=60&fullscreen&night
The part that says refresh=60 sets the dashboard to automatically refresh every 60 seconds, fullscreen sets it to fullscreen mode. Use an ampersand, &, in between keywords, and make sure there’s a hash, #, after the dashboard’s ID number.
There is one important limitation with the fullscreen option: for security reasons, many browsers require user interaction to initiate fullscreen. In those browsers, using the fullscreen option will enable the fullscreen UI in Metabase, but it won’t expand the browser content to fill the screen. To ensure the dashboard occupies the entire screen, either activate fullscreen by clicking the button in the UI, or use the fullscreen URL option and launch the browser in fullscreen or kiosk mode.
Dashboard version history
For questions, dashboards, and models, Metabase keeps a version history for the previous fifteen versions of that item.
See History.
Verifying a dashboard
See content verification.
Deleting a dashboard
Tips on creating helpful dashboards
To make a great dashboard, you first need to decide what you want the dashboard to tell about your data. What questions will give you insight into what you want to know? It helps to think of a topic or theme for your dashboard — something like “customer satisfaction,” or “second quarter sales goals”.
Some tips:
- Emphasize the most important questions. To draw people’s attention to what matters most, place the most important saved question cards near the top of the dashboard, and/or make them bigger than the other cards,
- Keep dashboards focused. If you have more than 10 cards on a dashboard, think about breaking the dashboard into two separate ones. You don’t want to overwhelm people with too much information, and each dashboard should revolve around one theme or topic. Remember — you can make as many dashboards as you want, so you don’t have to cram everything into just one.
- Add filters to your dashboard. Adding filters to dashboards makes them more useful. For example, instead of your dashboard being full of questions that are restricted to a specific time span, you can make more general questions and use dashboard filters to change the time span you’re looking at.
- Make your dashboards interactive. Customize what happens when users click on a chart or table in your dashboard.
Further reading
- Dashboard filters
- Interactive dashboards
- Dashboard charts with multiple series
- Dashboard subscriptions
- Making dashboards faster
Read docs for other versions of Metabase.