


Custom visualizations
Custom visualizations is only available on Pro and Enterprise plans (both self-hosted and on Metabase Cloud).
You can build new chart types and add them to Metabase. Here’s a calendar heatmap:
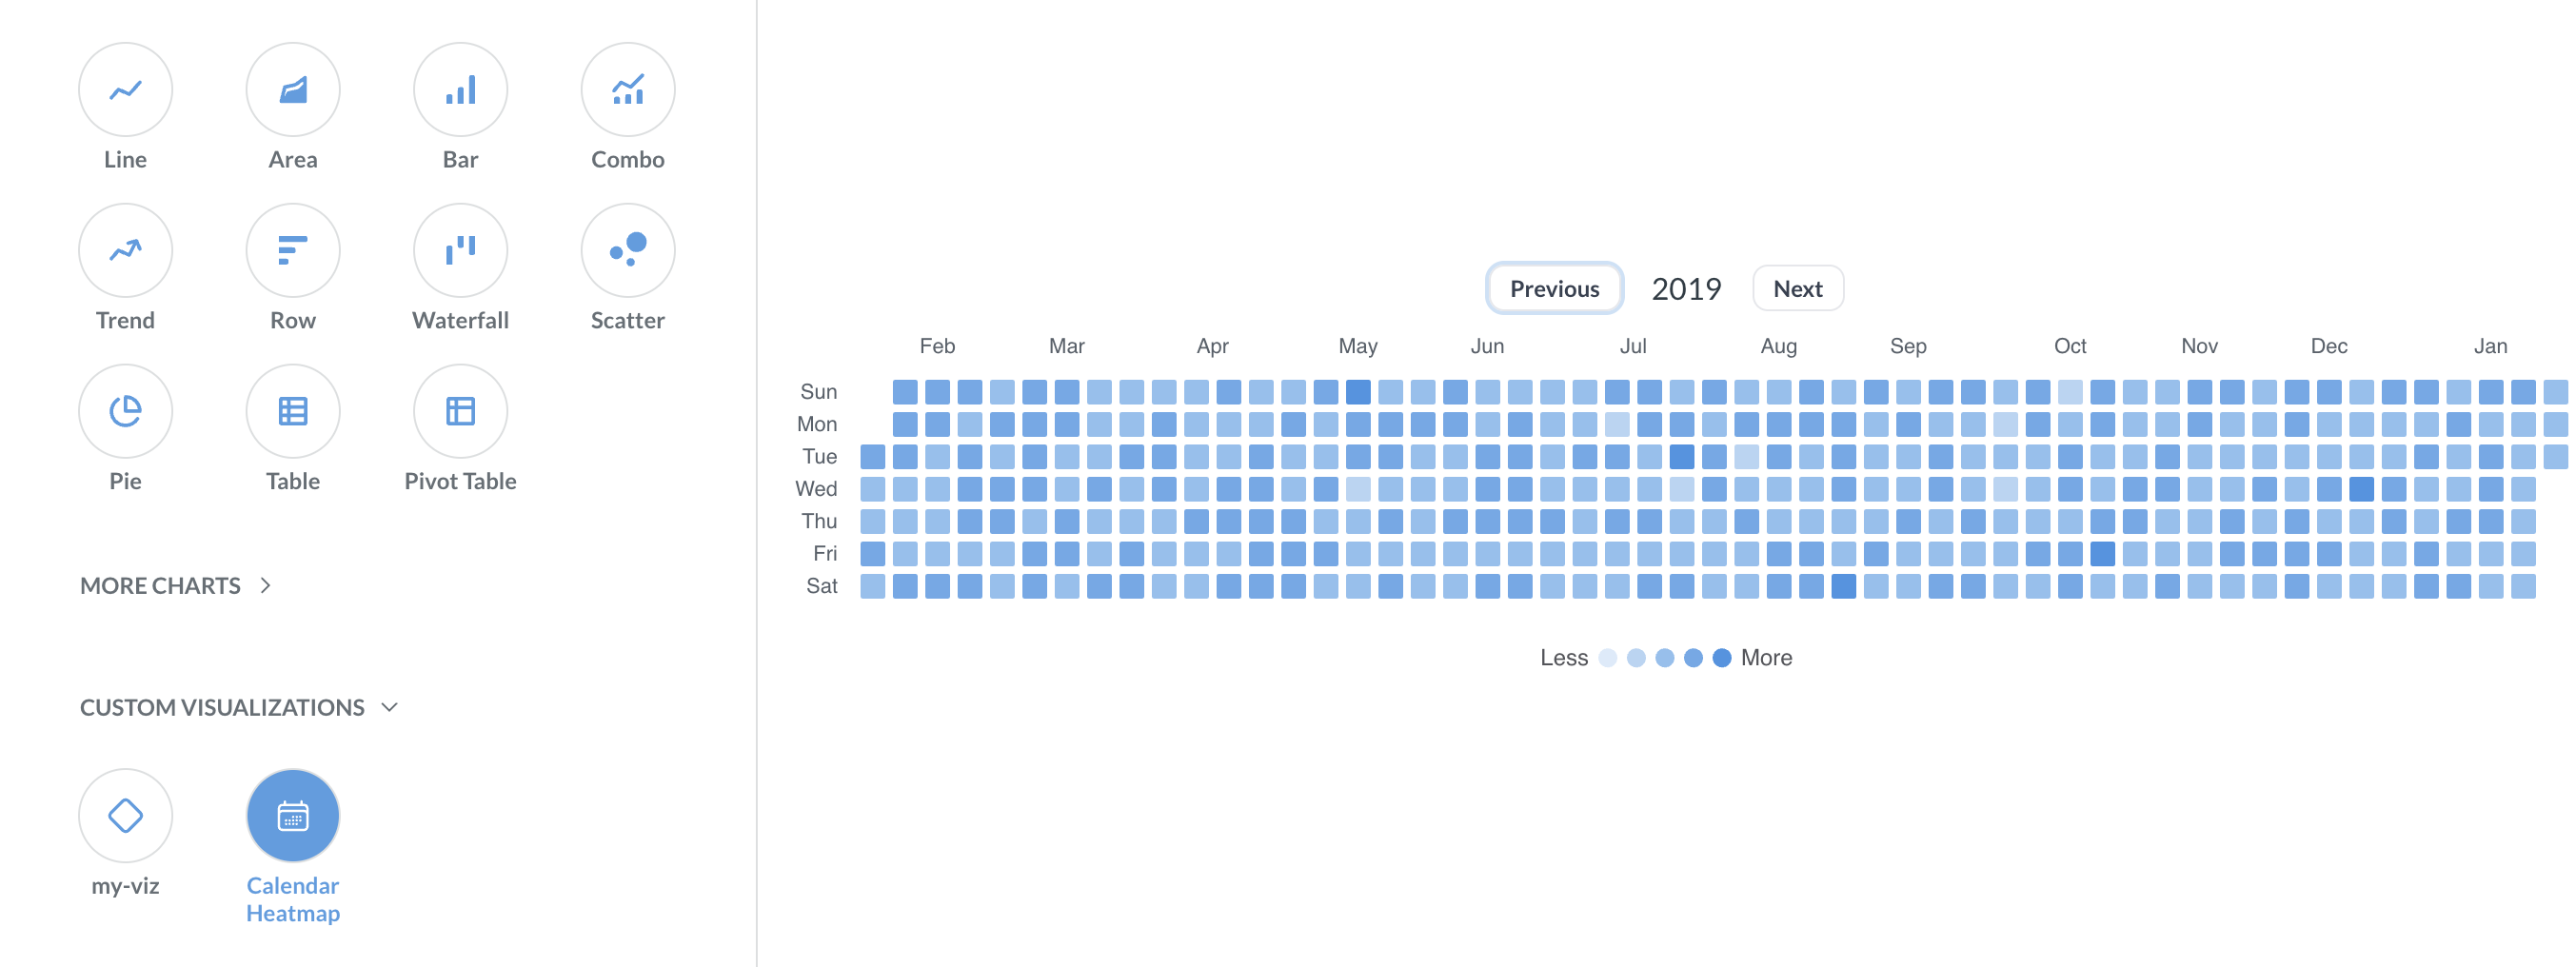
Here’s the code for that calendar heatmap viz.
This page covers how to add a custom visualization to your Metabase. To create a new custom visualization, see developing a custom visualization.
Enabling custom visualizations
Restrict image domains first
Before you can turn on custom visualizations, you need to enable Restrict image domains. A custom visualization runs third-party JavaScript in your Metabase. By restricting image (and font) domains, you limit where that code can load assets from, which narrows the ways a custom visualization could leak data through outbound asset requests. See Only add visualizations you trust.
While custom visualizations are enabled, you can’t turn Restrict image domains back off. You’ll need to first disable custom visualizations.
Turn on custom visualizations
To turn on custom visualizations, go to Admin > Settings > Custom visualizations and click Enable custom visualizations.
You can also enable (or disable) custom visualizations with the MB_CUSTOM_VIZ_ENABLED environment variable, or with the custom-viz-enabled key in a configuration file.
Adding a custom visualization
Once you’ve built the custom visualization:
- In Metabase, go to Admin > Settings > Custom visualizations > Manage visualizations.
- Click Add and drag the
.tgzfile into the upload area (or click to browse for it). - Click Add visualization.
- Bundles must be smaller than 5 MiB.
- Each custom visualization lists the Metabase versions it supports (for example, “Requires Metabase >=1.62”). If your Metabase version isn’t in that range, Metabase rejects the upload and tells you which version the visualization needs.
- The Manage visualizations page shows each custom visualization’s icon, name, the first eight characters of the bundle’s hash, and its required Metabase version range, so you can tell which version is installed.
Using a custom visualization
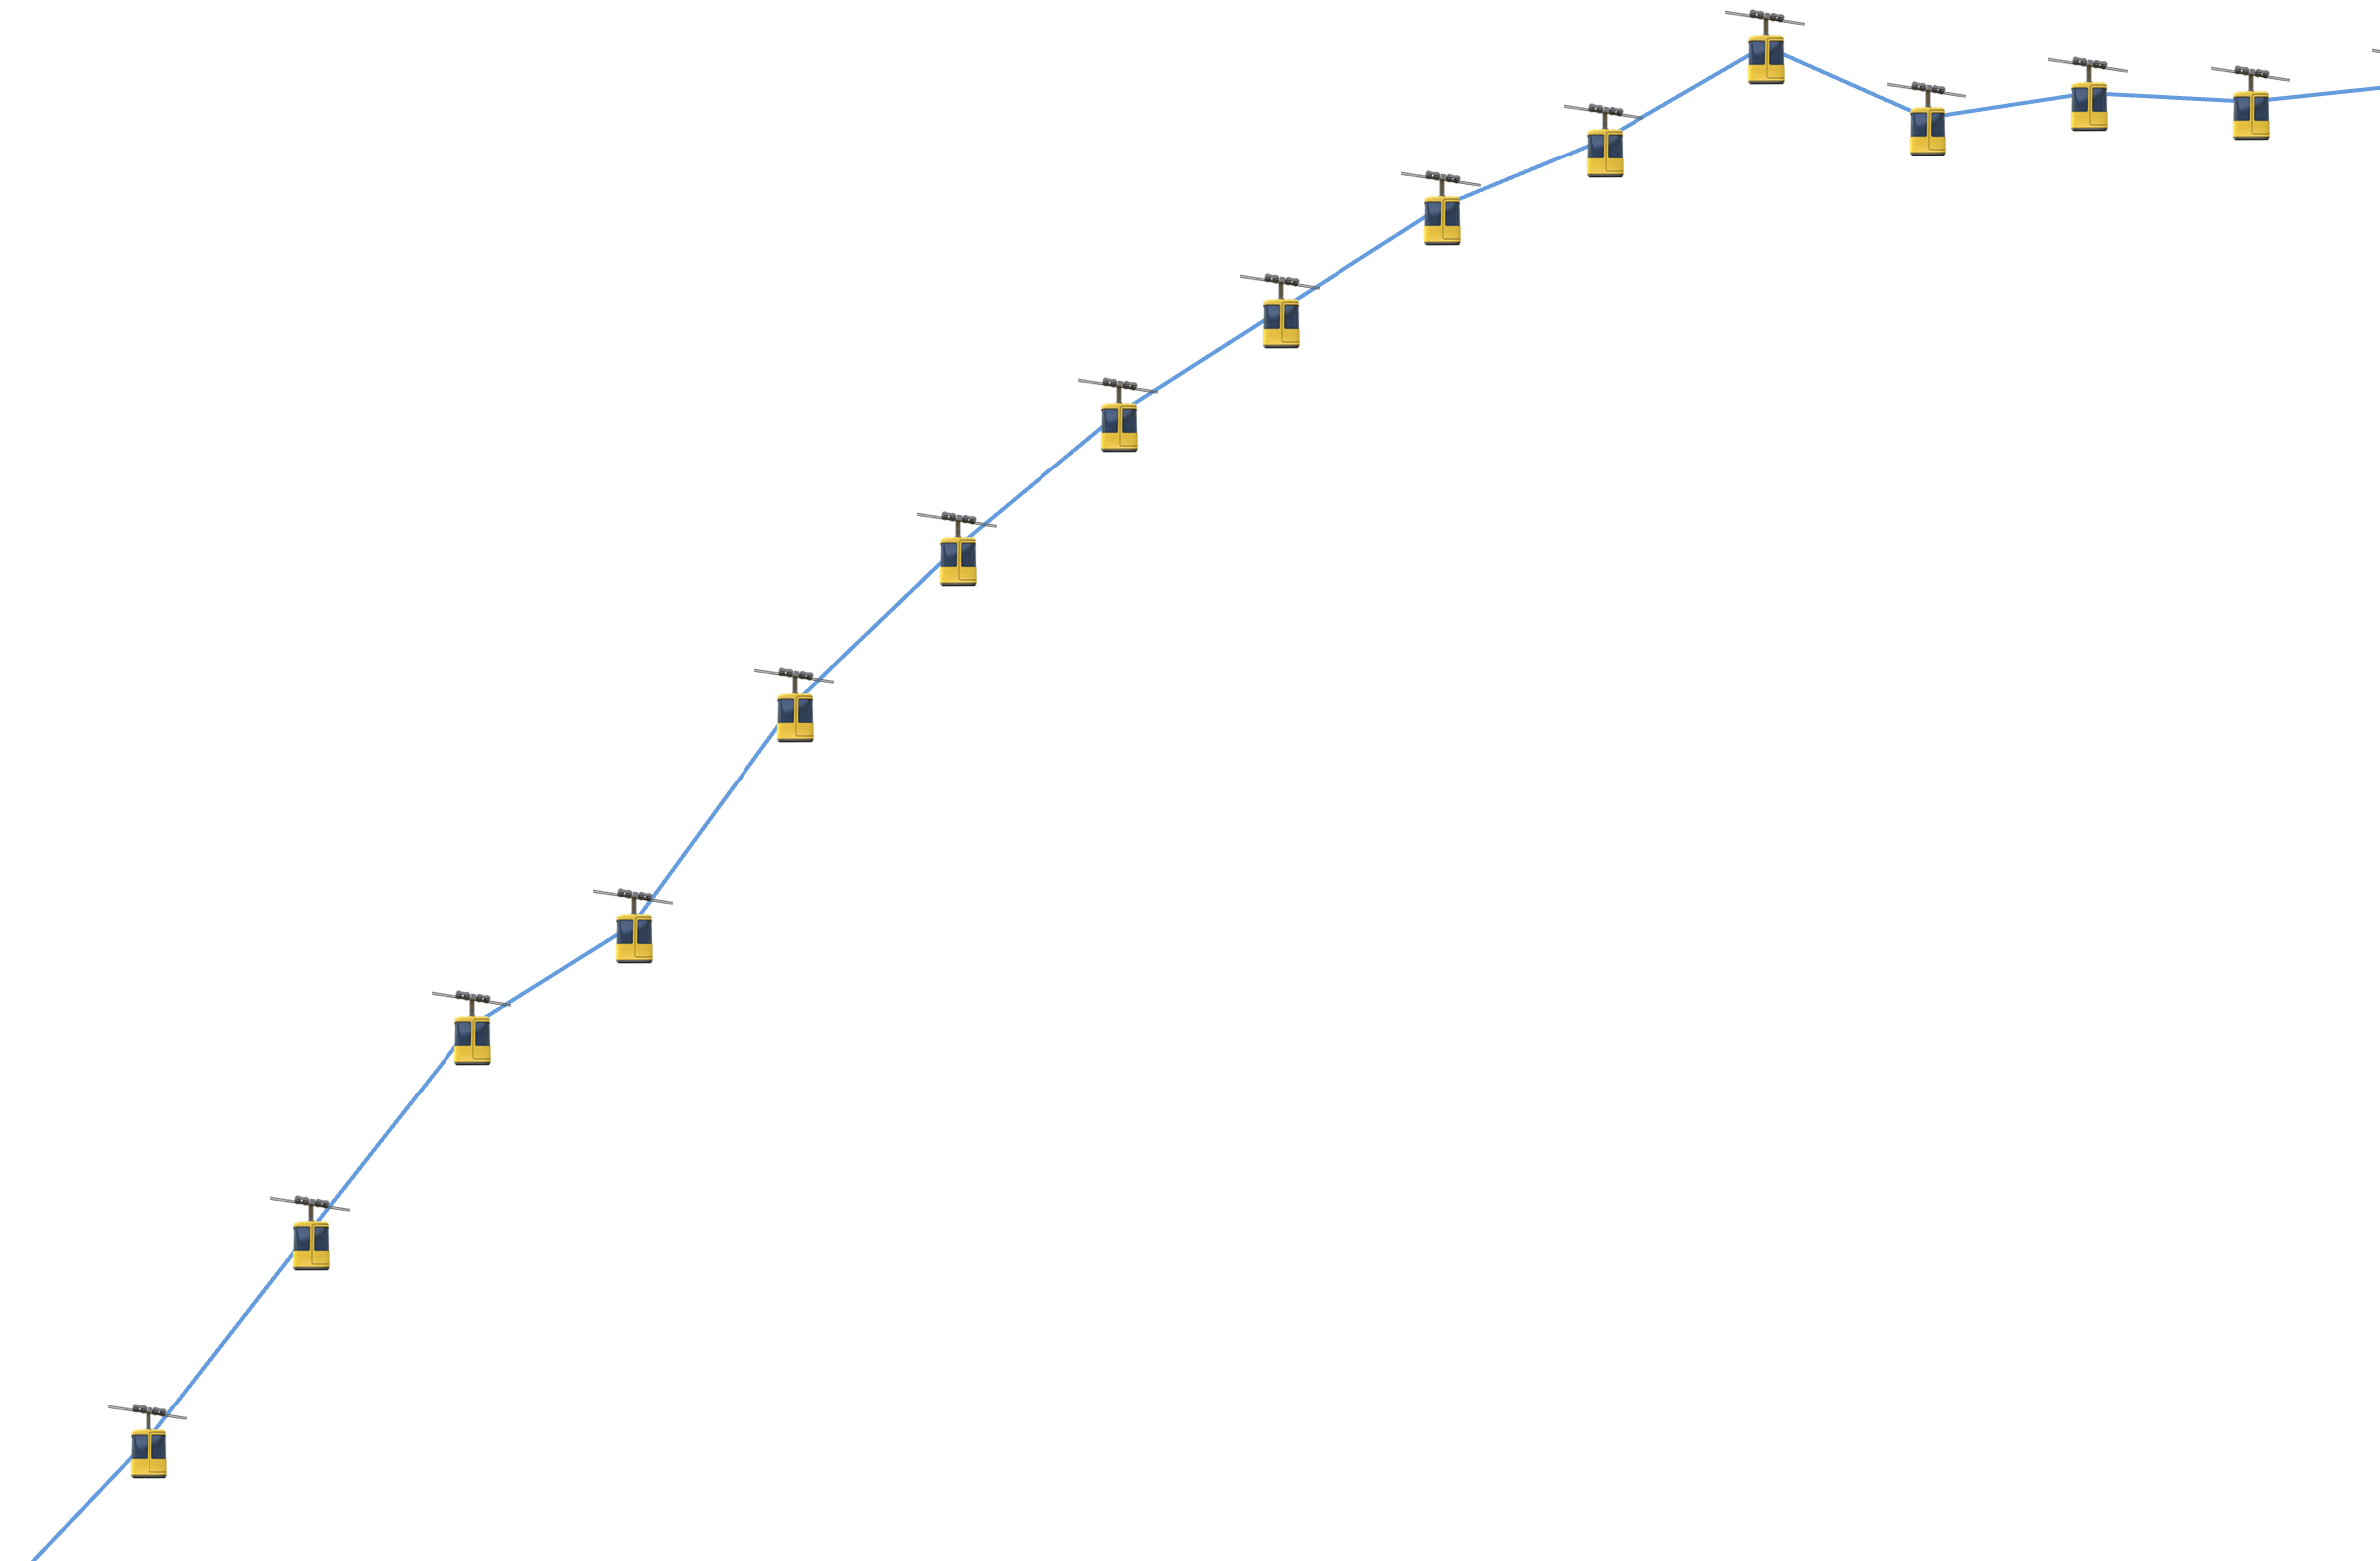
On a question, dashboard or document card, open the visualization sidebar (the Visualization button), and look for the Custom visualizations section. Pick your visualization the same way you’d pick a line chart or a table, and voilà, there’s that gondola line chart you needed:
If a custom visualization can’t render the current query results (for example, if the query is missing a column the visualization needs), Metabase shows the error message from the custom visualization so you can adjust the query or pick a different chart.
Custom visualizations behave like built-in charts in most places:
- Settings. Click the gear icon in the visualization sidebar to change the visualization’s settings. A custom visualization defines its own setting tabs: each setting names the section it belongs to.
- Dark mode. Custom visualizations that use Metabase’s colors adapt to dark mode automatically.
- Icons. A custom visualization shows its own icon in the visualization picker, and questions that use it show that icon in collections and bookmarks.
Custom visualizations in embeds only work when using the SDK
The Modular embedding SDK can render custom visualizations. You allowlist the custom visualizations you want to load with the allowedCustomVisualizations prop on MetabaseProvider.
Other embedding types don’t render custom visualizations. In modular embedding with web components, guest and static embeds, and public links, any card that uses a custom visualization falls back to the default visualization for the query’s results.
Managing custom visualizations
Admin > Settings > Custom visualizations > Manage visualizations
- Disable a visualization. Any question, dashboard card, or document card that used the visualization falls back to the default visualization for that query’s results. If you re-enable the visualization, those cards will go back to using the custom visualization.
- Replace a bundle. Upload a new
.tgzto ship an updated version of a custom visualization. The new bundle’s manifestnamemust match the existing visualization’s identifier, so questions that already use the visualization keep working. - Remove a visualization. Cards that used the custom viz fall back to the default visualization.
Exports
- Dashboard subscriptions and alerts don’t use custom visualizations. Cards that use custom visualizations will fall back to a default visualization for the card’s data shape.
- PDF exports of dashboards include custom visualizations.
- Custom visualizations can support PNG export, but only if its developer turned on PNG export for that visualization. PNG export is off by default.
Only add visualizations you trust
A custom visualization runs JavaScript in your Metabase. Only upload custom visualizations from sources you trust (like ones you’ve built yourself, or have vetted).
Metabase runs custom visualizations in a sandbox to limit what a custom visualization can do:
- A custom visualization renders inside an isolated container and can’t reach the rest of the Metabase app.
- A custom visualization can’t call Metabase’s APIs or make network requests.
While this sandboxing limits the damage a custom visualization can do, you still need to review the code.
Further reading
Read docs for other versions of Metabase.